Over 5 million people trade with @zerodhaonline

But ~90% don't know how to use their charting software optimally

Here are the 7 cool things you can do which you never knew 🧵

Collaborated with @AdityaTodmal

Many traders love @tradingview charting tool, but don't have a paid version/too lazy to follow the hacks that we shared

Traders who use @zerodhaonline as their broker platform can use @tradingview charting tool for free

Read this entire thread to know more
First things first, the default charting tool in Zerodha is ChartIQ

Change that to @tradingview by clicking on the profile settings
1. How to add indicators?

Open a blank chart & thereafter click on indicators to add whichever indicators you wish to add
2. How to customize further within an indicator?

For further settings within any indicator simply select the tool settings icon
How many max indicators can be added?

Bonus: No limit, so you can add any no. of indicators
3. How to check multiple charts in a same screen?

Select layout and select the grid basis the no. of charts you want to view
4. How to view same chart in different time frame?

You can do multi time frame analysis, using the grid layout
5. How to check multiple stocks in the same screen?

Example: Multiple charts in 8 grid layout
6. How to save the layouts?

Finally don't forget to Save your layout if you use it every now & then
7. How to take picture of the charts?

To take a picture of your screen just click on that camera icon & share it on your SM platforms
This is how you can use all the @tradingview features for free with the @zerodhaonline Platform

Go make use of it!
If you missed the hacks on TradingView, catch it here:

https://t.co/1kwRH3ICov
If you ❤️ this, why not share?

Retweet the first tweet and help others find this 🧵

You can check out our other threads 😃✌️

Follow us:

@AdityaTodmal

&

@niki_poojary

for more such interesting 🧵!

More from Nikita Poojary

More from Screeners

Time for a new thread on the possibilities I am looking for.
Do read it completely to understand the stance and the plan.


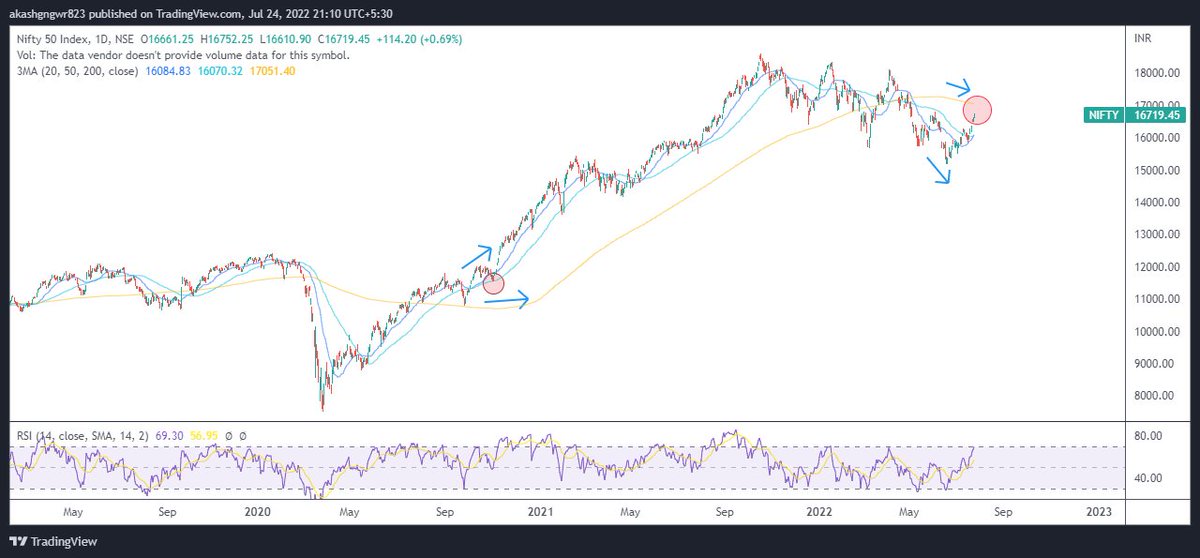
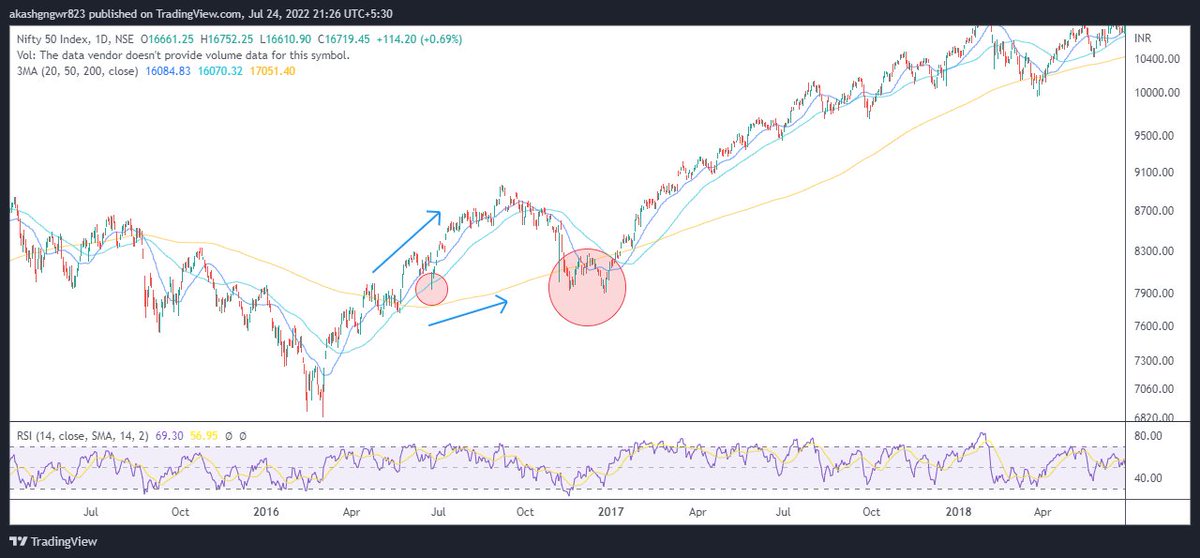
1. The moving average structure - Many traders just look at the 200 ma test or closing above/below it regardless of its slope. Let's look at all the interactions with 200 ma where price met it for the first time after the trend change but with 200 ma slope against it


One can clearly sense that currently it is one of those scenarios only. I understand that I might get trolled for this, but an unbiased mind suggests that odds are highly against the bulls for making fresh investments.

But markets are good at giving surprises. What should be our stance if price kept on rising? Let's understand that through charts. The concept is still the same. Divergent 200 ma and price move results in 200 ma test atleast once which gives good investment opportunities.


2. Zig-Zag bear market- There are two types of fall in a bear market, the first one is vertical fall which usually ends with ending diagonals (falling wedges) and the second one is zig zag one which usually ends with parabolic down moves.

You May Also Like