
These are long term Moving Averages, which in my view are irrelevant for short term positional trades.
For my trading strategy, 13-day & 22-day EMAs are more suitable.
If SmallCap dips below these MAs & they get into the bearish sync, I get cautious & reduce my position size.
Sir as you follow the smallcap index,do you take full positions when it\u2019s trading below its key moving averages or wait for some confirmation? pic.twitter.com/ph6HTJ9rbD
— Dhanesh Gianani (@dhanesh500) November 30, 2021
More from Ravi Sharma
While buying breakouts, your odds will improve a lot when you prefer the following:
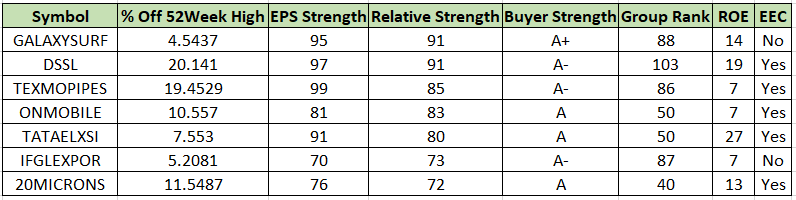
1. Strong Relative Strength.
2. Tight price range on low Volume and a pattern which is easy on eyes. https://t.co/CprKpAfgtj
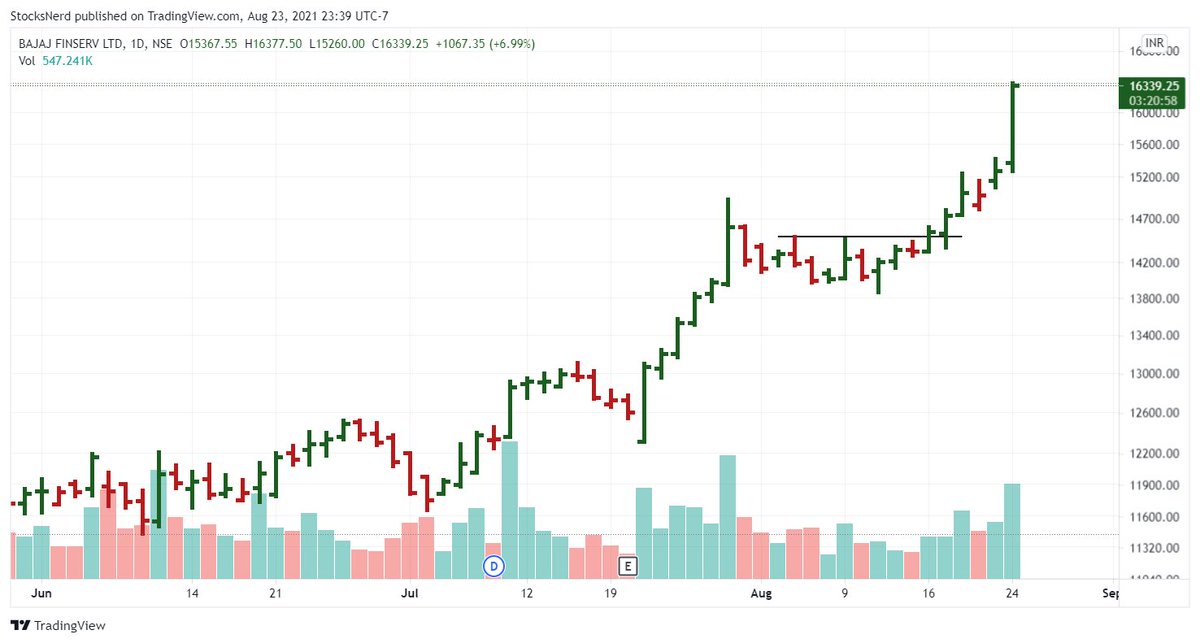
#BAJAJFINSV
— Ravi Sharma (@StocksNerd) August 14, 2021
Setting up in a tight base. Volume has been drying up.
Waiting for the breakout. pic.twitter.com/KWoGZAwkLO
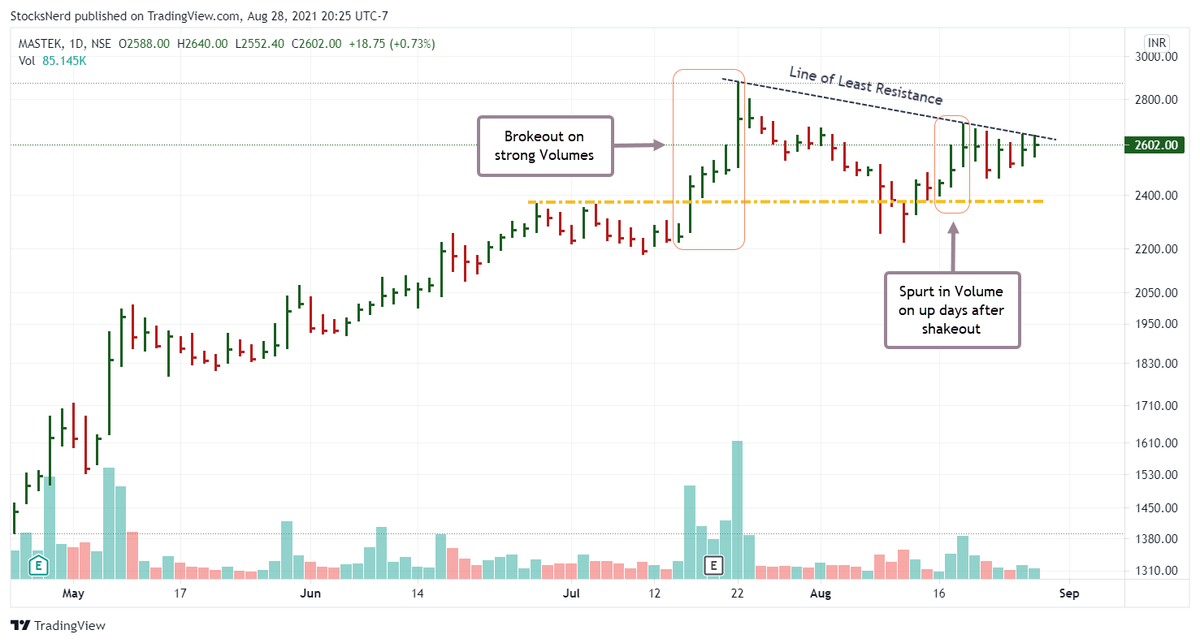
You would find the roots of all patterns, especially the trend/momentum following ones in their methods.
Once you get the dynamics of Price/Volume, any good book on chart patterns will do.
Any book in which we can read such patterns and the knowledge you have?
— Krish (@MasculinityMon1) August 13, 2021
Signs are all over the place, you just needed to read them. https://t.co/17bwpa1psj
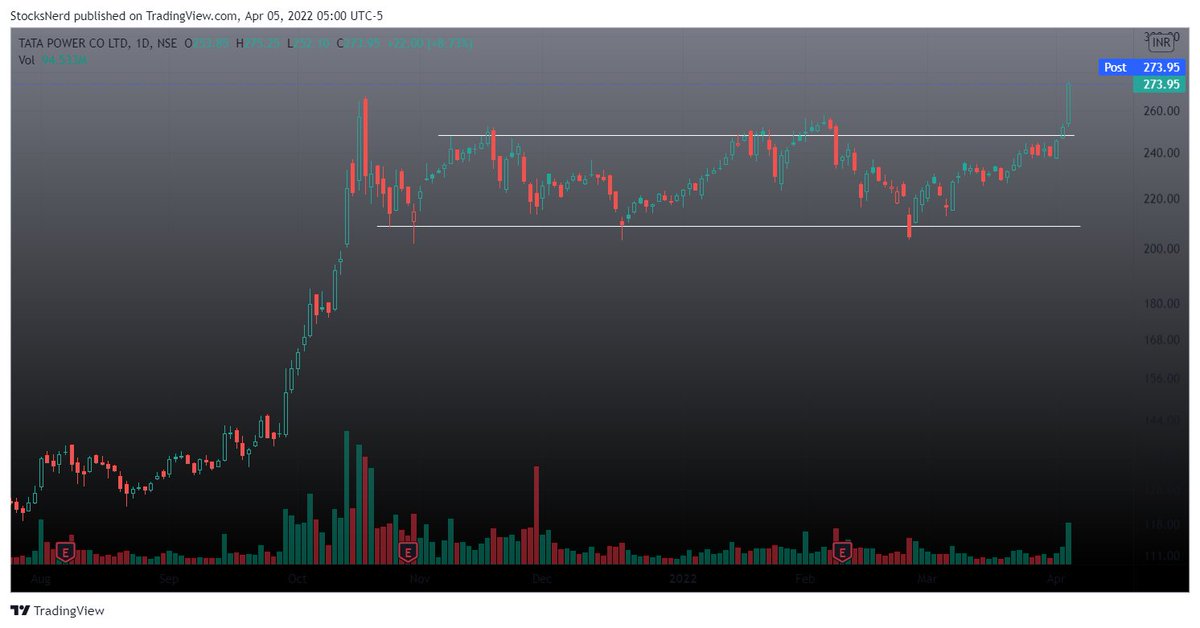
#TATAPOWER is consolidating nicely around 50 & 10-DMA.
— Ravi Sharma (@StocksNerd) April 1, 2022
3 Pocket Pivot days in the last couple of weeks are signaling the interest of buyers.
4 months long base.
Steady growth in Earnings & Sales in the last 3 quarters.
Relative Strength: 77
Group Rank: 22 pic.twitter.com/2WFeUGiV1z
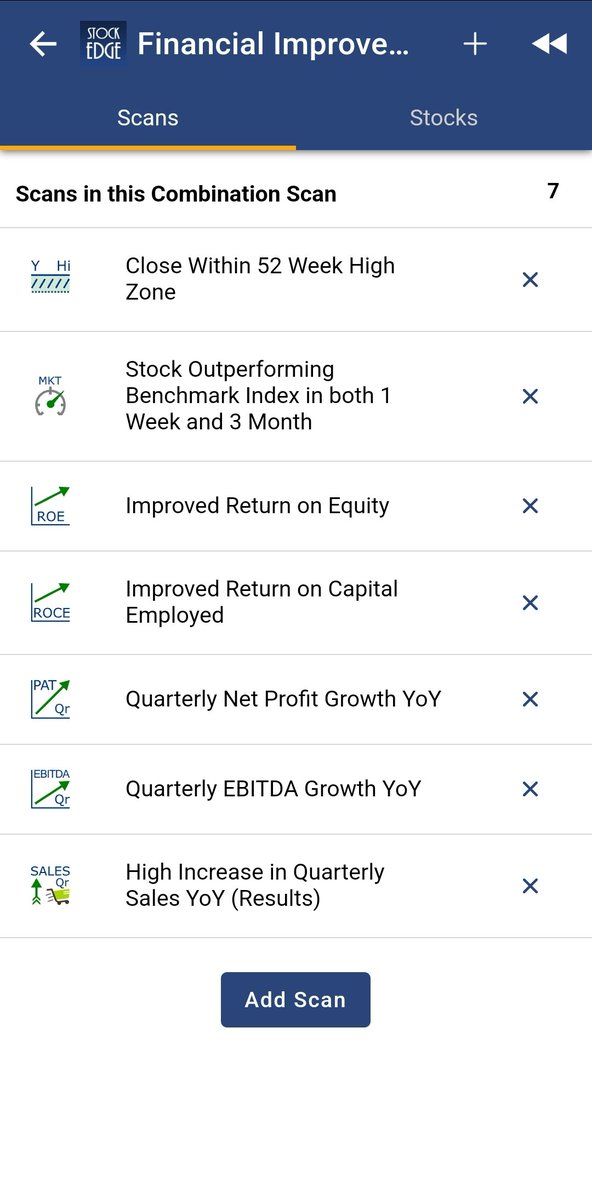
More from Screeners


Do Share the above tweet 👆
These are going to be very simple yet effective pure price action based scanners, no fancy indicators nothing - hope you liked it.
https://t.co/JU0MJIbpRV
52 Week High
One of the classic scanners very you will get strong stocks to Bet on.
https://t.co/V69th0jwBr
Hourly Breakout
This scanner will give you short term bet breakouts like hourly or 2Hr breakout
Volume shocker
Volume spurt in a stock with massive X times


#bearrun
#BearMarket
Head & Shoulders pattern, double top and bearish RSI divergences fail more often in bull market and generally gives a very good SAR trade. Vice versa is also true for bear market.#bullrun #BullMarket
— Aakash Gangwar (@akashgngwr823) February 9, 2021
You May Also Like


==========================
Module 1
Python makes it very easy to analyze and visualize time series data when you’re a beginner. It's easier when you don't have to install python on your PC (that's why it's a nano course, you'll learn python...
... on the go). You will not be required to install python in your PC but you will be using an amazing python editor, Google Colab Visit https://t.co/EZt0agsdlV
This course is for anyone out there who is confused, frustrated, and just wants this python/finance thing to work!
In Module 1 of this Nano course, we will learn about :
# Using Google Colab
# Importing libraries
# Making a Random Time Series of Black Field Research Stock (fictional)
# Using Google Colab
Intro link is here on YT: https://t.co/MqMSDBaQri
Create a new Notebook at https://t.co/EZt0agsdlV and name it AnythingOfYourChoice.ipynb
You got your notebook ready and now the game is on!
You can add code in these cells and add as many cells as you want
# Importing Libraries
Imports are pretty standard, with a few exceptions.
For the most part, you can import your libraries by running the import.
Type this in the first cell you see. You need not worry about what each of these does, we will understand it later.
