In India also we have many success stories like @VijayKedia1 @Raamdeo R K Damani Rakesh Jhunjhunwala Late Chandrakant Sampat and many many more....
Starting the Beginner’s Pathway thread for Fundamental Investing.
One Chadarmod on timeline posted that I’m giving gyan without having experience or expertise.
So I’ll begin with paying my portfolio performance tribute to these charlies.
https://t.co/GNM5SsNFNo
Sadda Haqq ! Aithe Rakhh......... pic.twitter.com/IH5q3v2gw9
— Professor (@DillikiBiili) October 5, 2021
In India also we have many success stories like @VijayKedia1 @Raamdeo R K Damani Rakesh Jhunjhunwala Late Chandrakant Sampat and many many more....
Rakesh Jhunjhunwala still trades, he once said Traing is fun, its le fatafat, de fatafat
https://t.co/yVjWRaVDtC
Few might have made money this way, but most do not. Why ?
There has to be a process.
Here is a preliminary checklist by the legendary investor Peter lynch
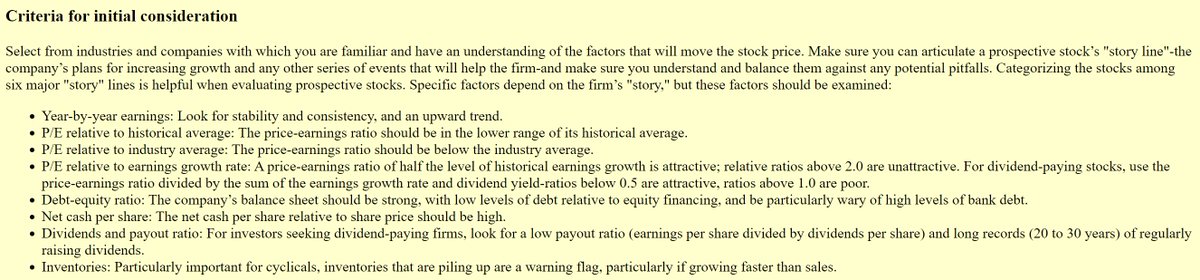
Hot stocks in hot industries.
Small firms) with too big plans
Profitable companies engaged in diversifying acquisitions. Lynch terms these "diworseifications."
Companies in which one customer accounts for 25% to 50% of their sales.
Here is a very good example of how can we analyze a company.
https://t.co/i5QTUDUCyK
More from Professor

More pointers to help in identifying whether its accumulation or Distribution.
Lest some charlie jumps to point out, let me make it clear that I haven't invented anything in stock market, all my knowledge of stock market comes from old farts. Just my observation is my own. https://t.co/uHNw8tV4AO
Lest some charlie jumps to point out, let me make it clear that I haven't invented anything in stock market, all my knowledge of stock market comes from old farts. Just my observation is my own. https://t.co/uHNw8tV4AO
Plz advice how to identify accumulation and distribution phase...... to me Both looks same
— VIVEK VAID (@bobvaid) February 12, 2022
Bringing Data Science to Nifty Analysis. A small 🧵
As per Normal Distribution 68% of the time movement is with 1% SD Limits.
For 95% pf the times movement is within 2% SD limits.
And its only 0.3% of the times that movement exceeds 3 SD.
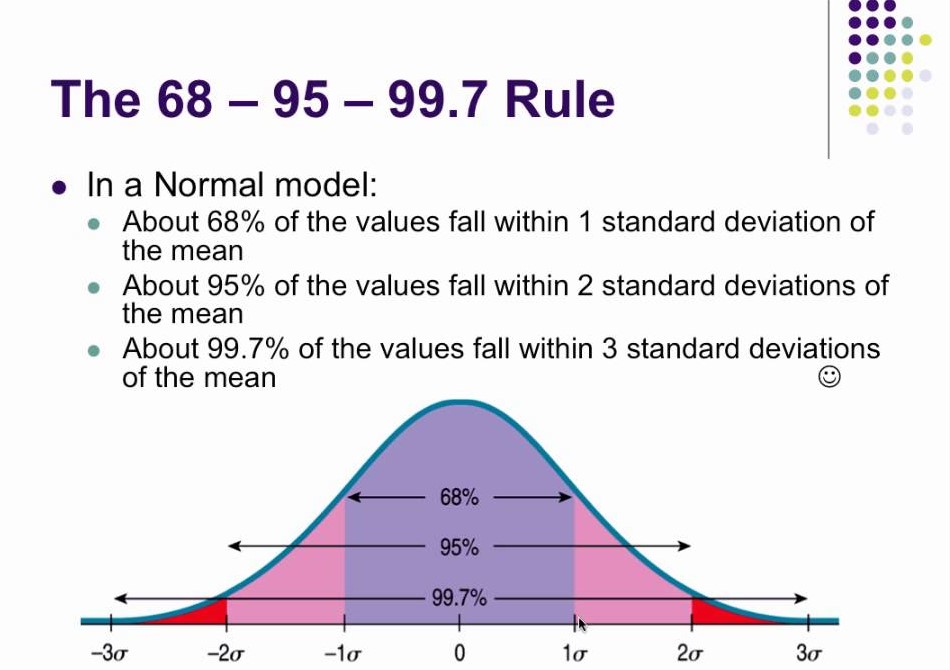
Since 95% covers a lot of ground that's why 2SD is considered to be a a safe range for most events.
The farther we move from the average, chances of occurrence go down. This is what Taleb sahab calls Tail risk, because it lies in the tail of the standard distribution curve.
Normal distribution occurs everywhere. See this
Bollinger Band, which is a very popular indicator has a setting of 2SD. Because its expected that 95% of the time moves will be confined to 2SD limits.
When we say that price is at upper/lower Bollinger band, we are saying that it has reached 2 SD limits and likely to reverse.
Now coming to current scenario, open Nifty daily chart and apply two bollinger Bands on it.
First with default setting and in second change settings to 3 standard deviation.
Crossing 3 SD boundary means that Nifty is now in very rare territory where it has been only 0.3%
As per Normal Distribution 68% of the time movement is with 1% SD Limits.
For 95% pf the times movement is within 2% SD limits.
And its only 0.3% of the times that movement exceeds 3 SD.
Since 95% covers a lot of ground that's why 2SD is considered to be a a safe range for most events.
The farther we move from the average, chances of occurrence go down. This is what Taleb sahab calls Tail risk, because it lies in the tail of the standard distribution curve.
Normal distribution occurs everywhere. See this
The Galton Machine shows order from randomness. Each ball bounces left or right at random, 12 times, but together where they fall can be predicted - the normal distribution. This one made by: https://t.co/oI9wOGq7nG pic.twitter.com/VQtVu66OSE
— Tom Stafford (@tomstafford) April 19, 2018
Bollinger Band, which is a very popular indicator has a setting of 2SD. Because its expected that 95% of the time moves will be confined to 2SD limits.
When we say that price is at upper/lower Bollinger band, we are saying that it has reached 2 SD limits and likely to reverse.
Now coming to current scenario, open Nifty daily chart and apply two bollinger Bands on it.
First with default setting and in second change settings to 3 standard deviation.
Crossing 3 SD boundary means that Nifty is now in very rare territory where it has been only 0.3%

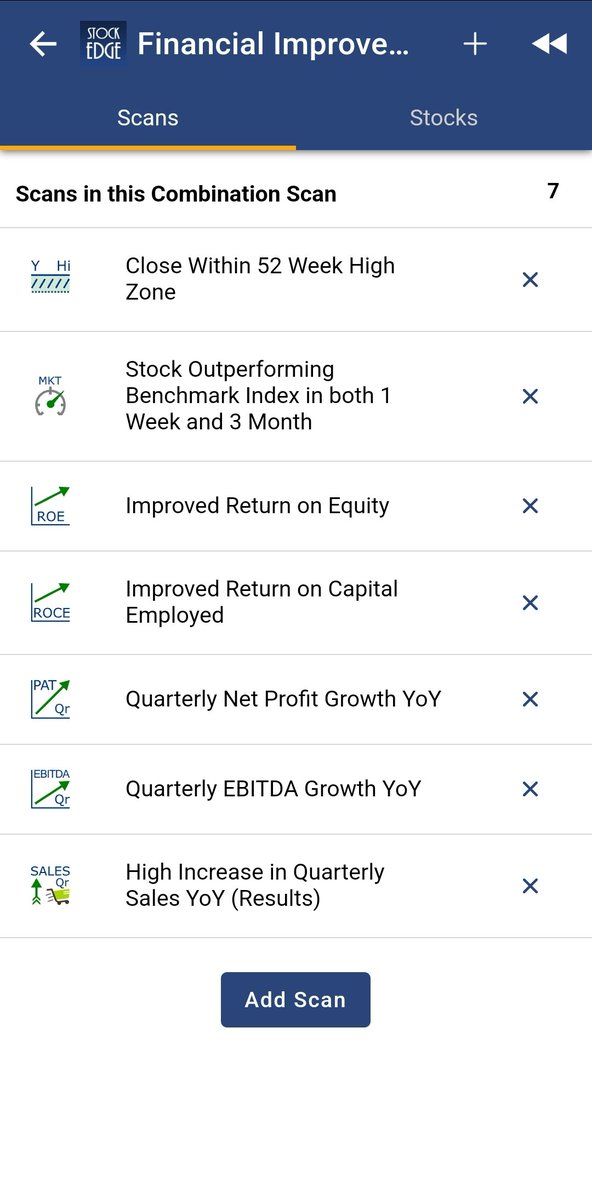
More from Screeners

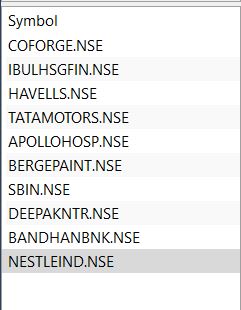

I use 4 scanners:
1) Volatility, Volume & daily range compression scanner
2) Punch-Drunk-Love
3) GE Ratio - to track fundamentally strong stocks
4) Recently created one to track Power Play setups.
I get around 150-200 stocks daily & choose the ones with the most potential.
1) Volatility, Volume & daily range compression scanner
2) Punch-Drunk-Love
3) GE Ratio - to track fundamentally strong stocks
4) Recently created one to track Power Play setups.
I get around 150-200 stocks daily & choose the ones with the most potential.
Sir, How do u find a set up - Do you track chart of each stock daily ? Or do u have filters , that lead you to a number of stocks , after which you scan them.
— AKASH GUPTA (@lockdownmurti) August 25, 2021


You May Also Like


THREAD: 12 Things Everyone Should Know About IQ
1. IQ is one of the most heritable psychological traits – that is, individual differences in IQ are strongly associated with individual differences in genes (at least in fairly typical modern environments). https://t.co/3XxzW9bxLE
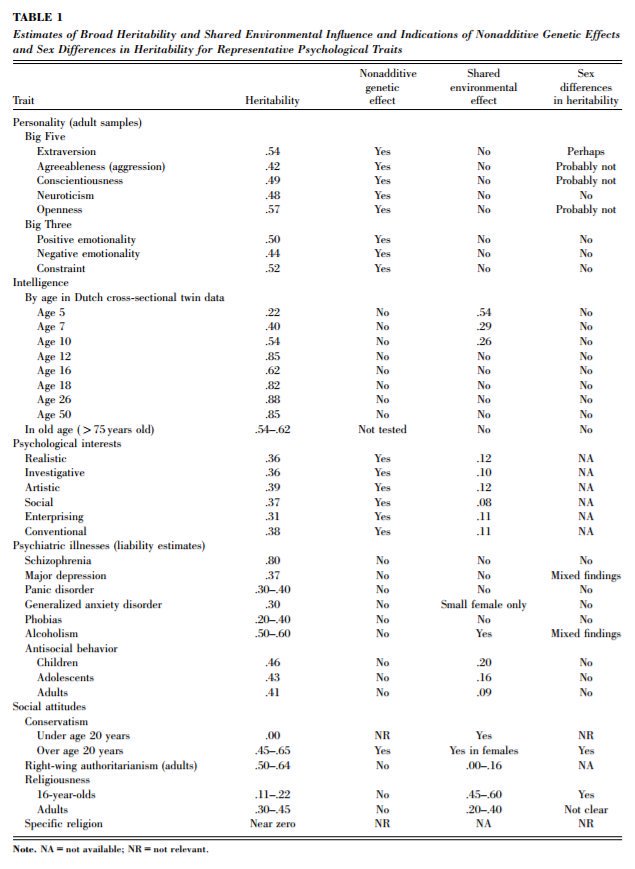
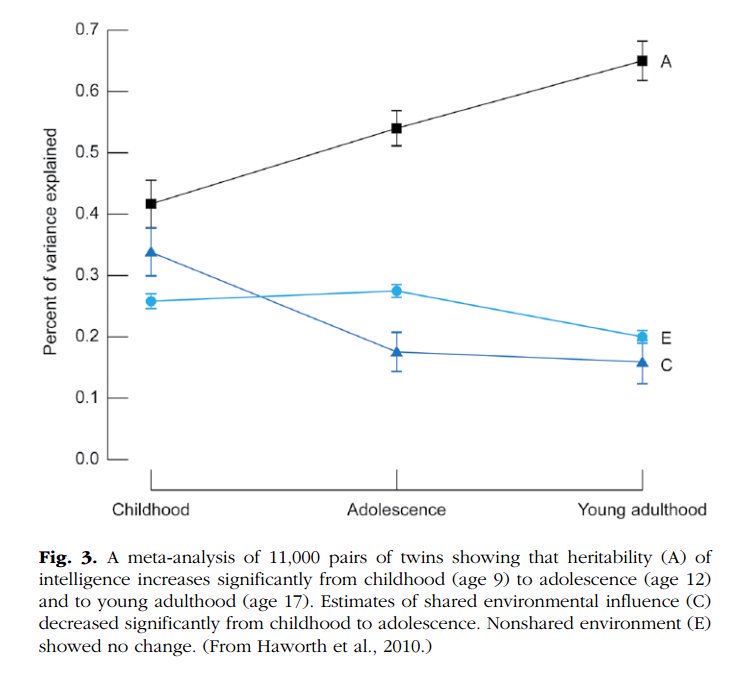
2. The heritability of IQ *increases* from childhood to adulthood. Meanwhile, the effect of the shared environment largely fades away. In other words, when it comes to IQ, nature becomes more important as we get older, nurture less. https://t.co/UqtS1lpw3n
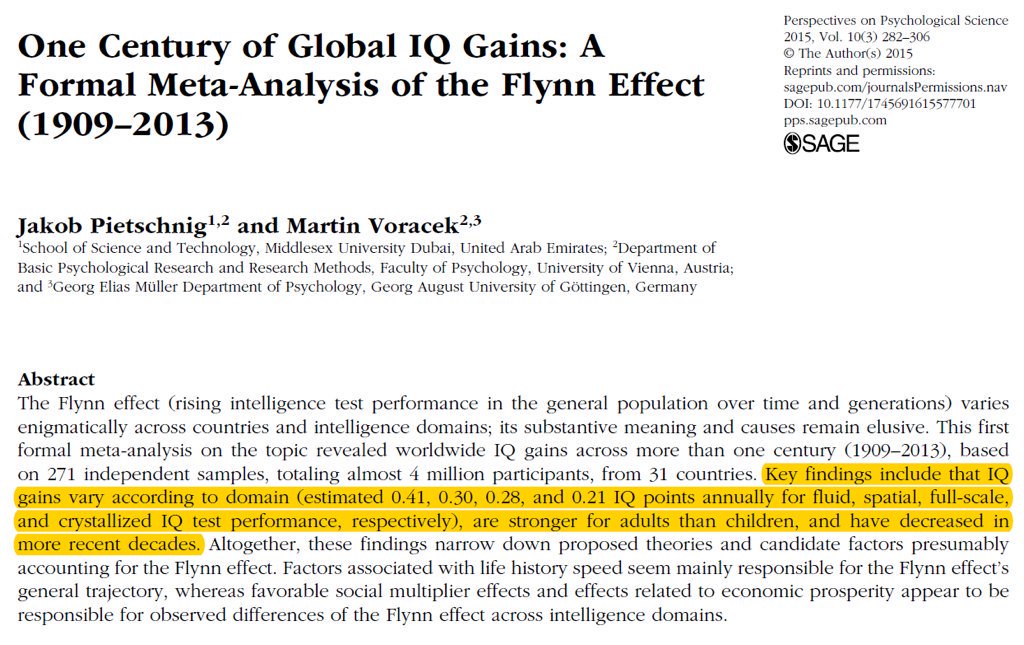
3. IQ scores have been increasing for the last century or so, a phenomenon known as the Flynn effect. https://t.co/sCZvCst3hw (N ≈ 4 million)
(Note that the Flynn effect shows that IQ isn't 100% genetic; it doesn't show that it's 100% environmental.)
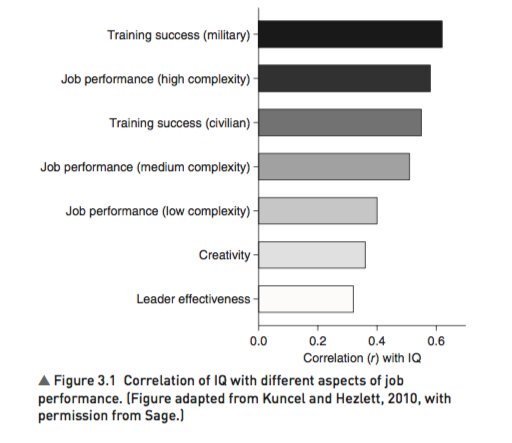
4. IQ predicts many important real world outcomes.
For example, though far from perfect, IQ is the single-best predictor of job performance we have – much better than Emotional Intelligence, the Big Five, Grit, etc. https://t.co/rKUgKDAAVx https://t.co/DWbVI8QSU3
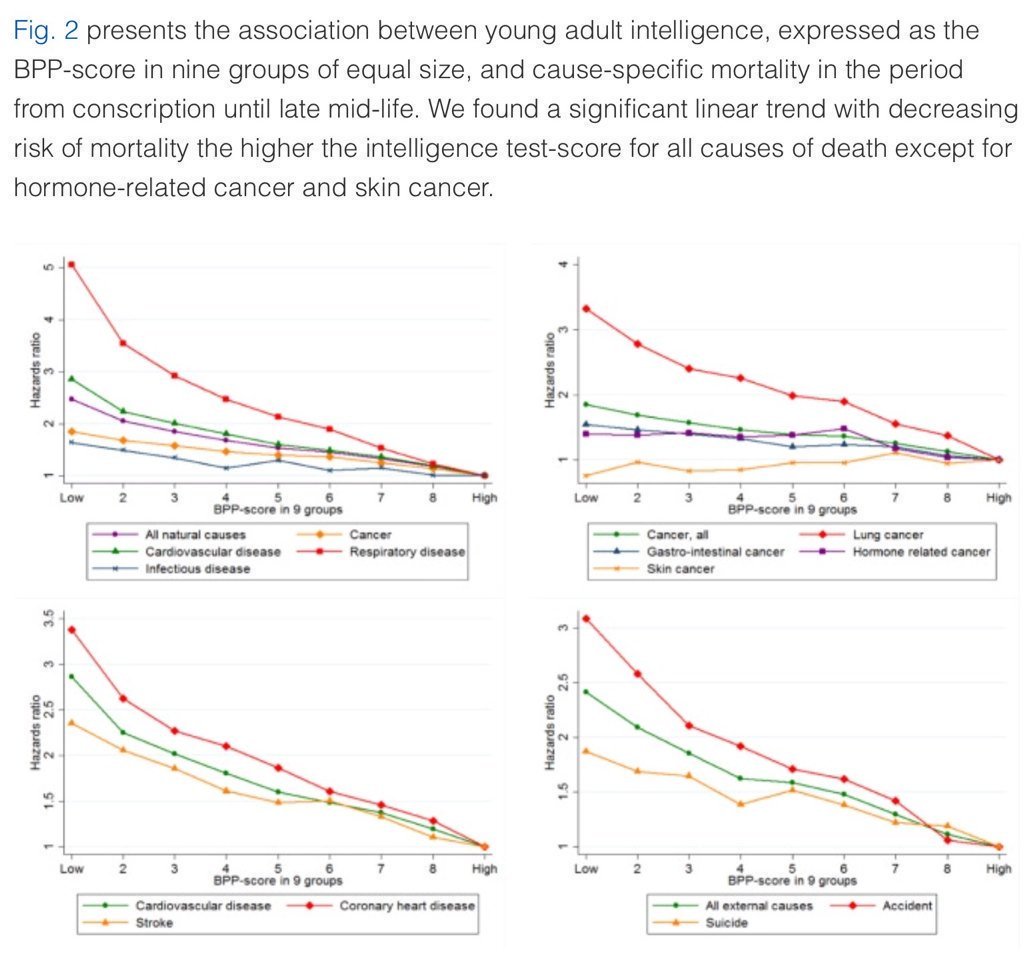
5. Higher IQ is associated with a lower risk of death from most causes, including cardiovascular disease, respiratory disease, most forms of cancer, homicide, suicide, and accident. https://t.co/PJjGNyeQRA (N = 728,160)
1. IQ is one of the most heritable psychological traits – that is, individual differences in IQ are strongly associated with individual differences in genes (at least in fairly typical modern environments). https://t.co/3XxzW9bxLE
2. The heritability of IQ *increases* from childhood to adulthood. Meanwhile, the effect of the shared environment largely fades away. In other words, when it comes to IQ, nature becomes more important as we get older, nurture less. https://t.co/UqtS1lpw3n
3. IQ scores have been increasing for the last century or so, a phenomenon known as the Flynn effect. https://t.co/sCZvCst3hw (N ≈ 4 million)
(Note that the Flynn effect shows that IQ isn't 100% genetic; it doesn't show that it's 100% environmental.)
4. IQ predicts many important real world outcomes.
For example, though far from perfect, IQ is the single-best predictor of job performance we have – much better than Emotional Intelligence, the Big Five, Grit, etc. https://t.co/rKUgKDAAVx https://t.co/DWbVI8QSU3
5. Higher IQ is associated with a lower risk of death from most causes, including cardiovascular disease, respiratory disease, most forms of cancer, homicide, suicide, and accident. https://t.co/PJjGNyeQRA (N = 728,160)