
Simple Moving Average is a widely used technical analysis tool. It’s simple yet very powerful !
Have you seen our Simple Moving Average Scans yet ? Check it out on the StockEdge App today ! @vivbajaj
#SMA #StocksToWatch #trading

More from StockEdge
🧵...
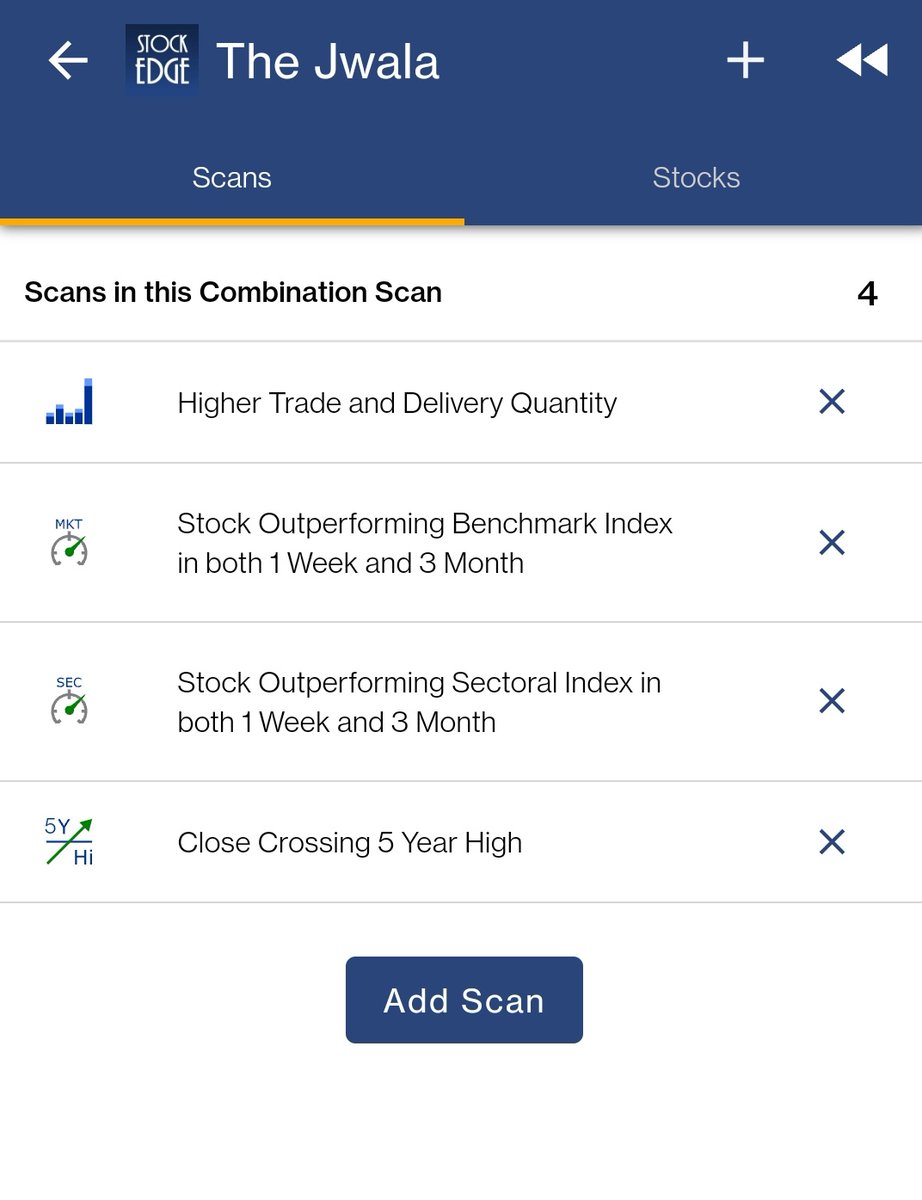
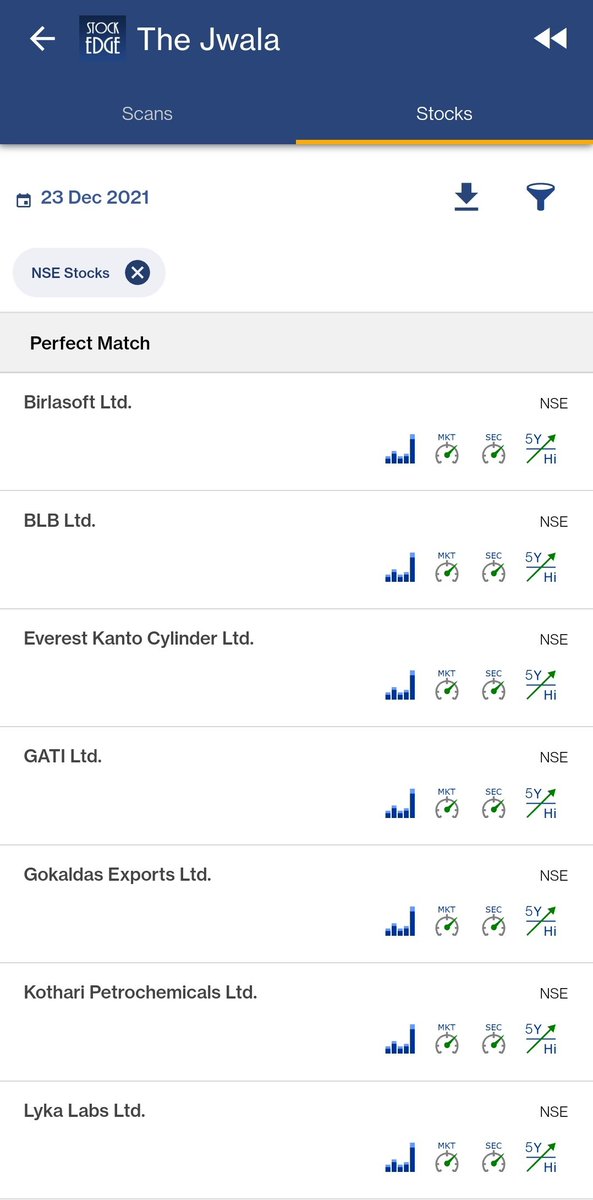
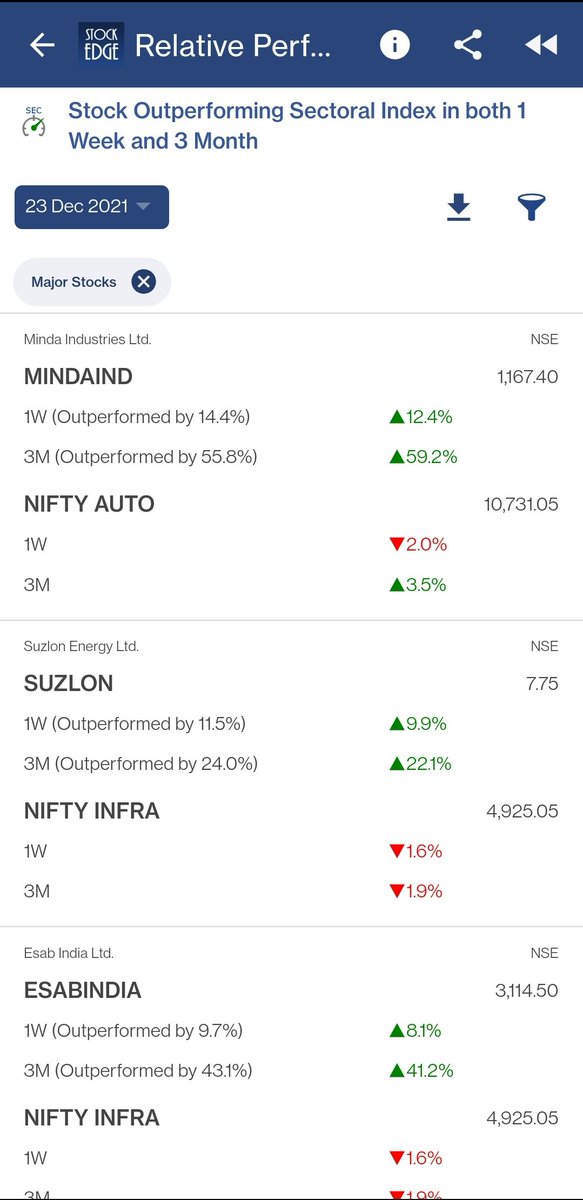
This combination scan identifies stocks that are outperforming Benchmark Indices & Sectoral Indices in 1 week as well as 3 months time frame which has given multi-year breakout, with higher trade and delivery quantity.
Some of the scans use in the combination include
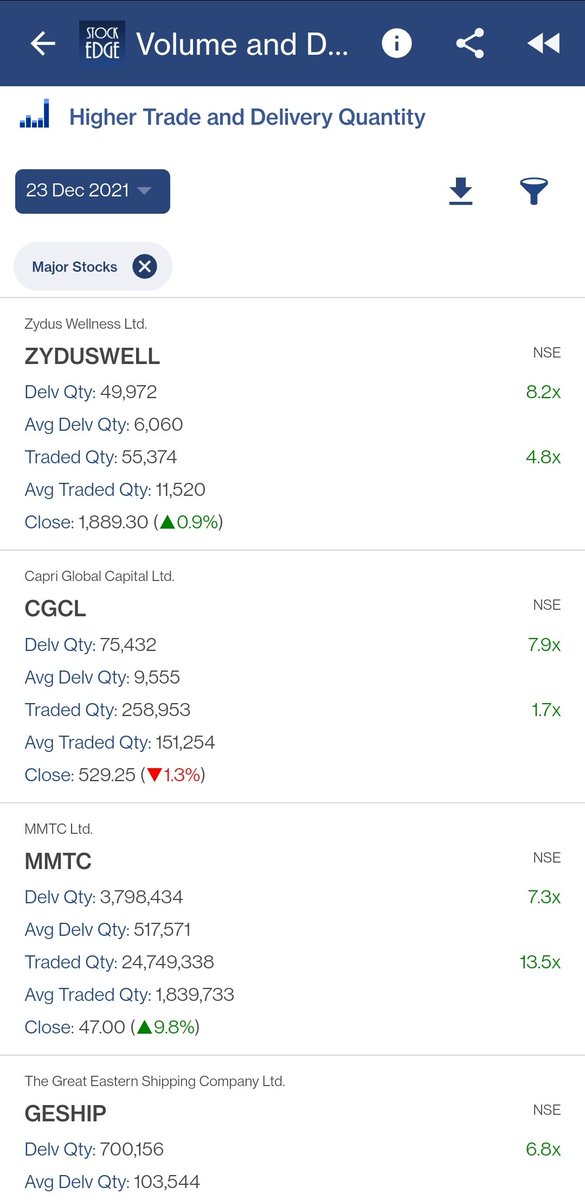
Higher Trade and Delivery Quantity: https://t.co/EL5Qei0mnp
The second scan used here is
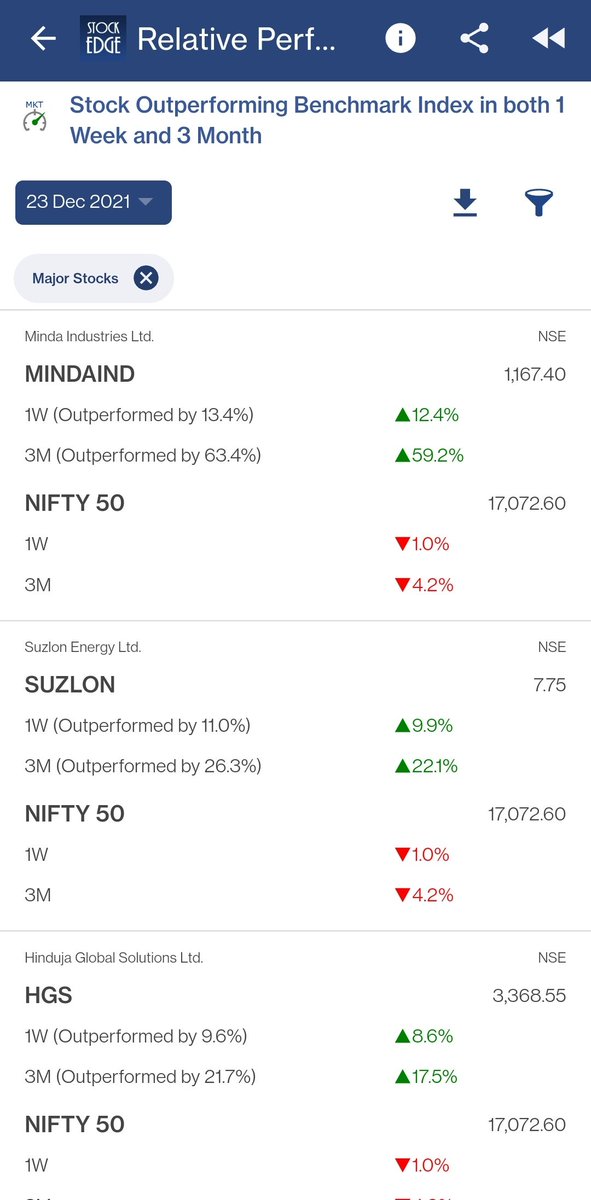
Stock Outperforming Benchmark Index In Both 1 Week And 3 Month: https://t.co/pcMzVXMbdO
The third scan used here is
Stock Outperforming Sectoral Index In Both 1 Week And 3 Month: https://t.co/ajJ8jIatdo
A THREAD(🧵)....(1/7)
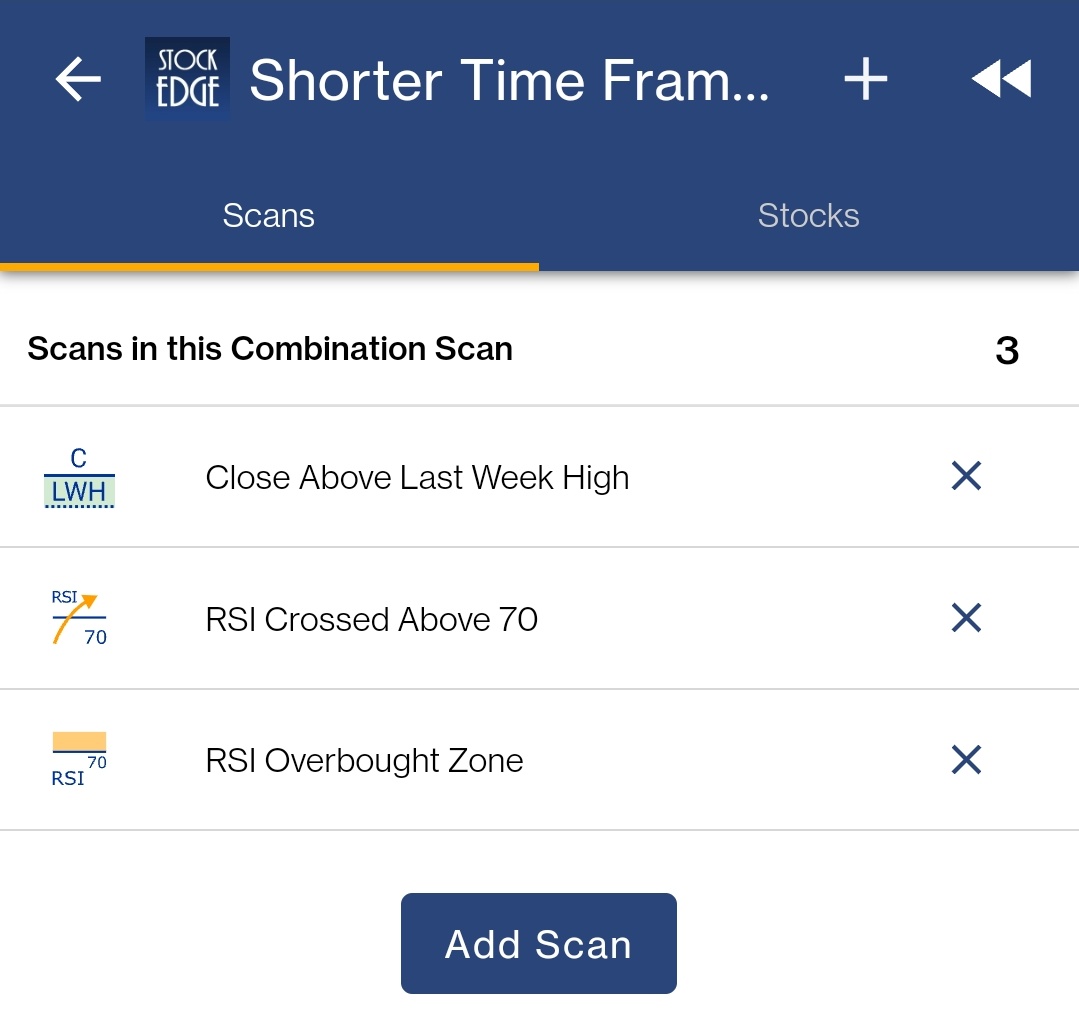
This Combo scan tries to filter stocks based on strong momentum for short term trades
(2/7)
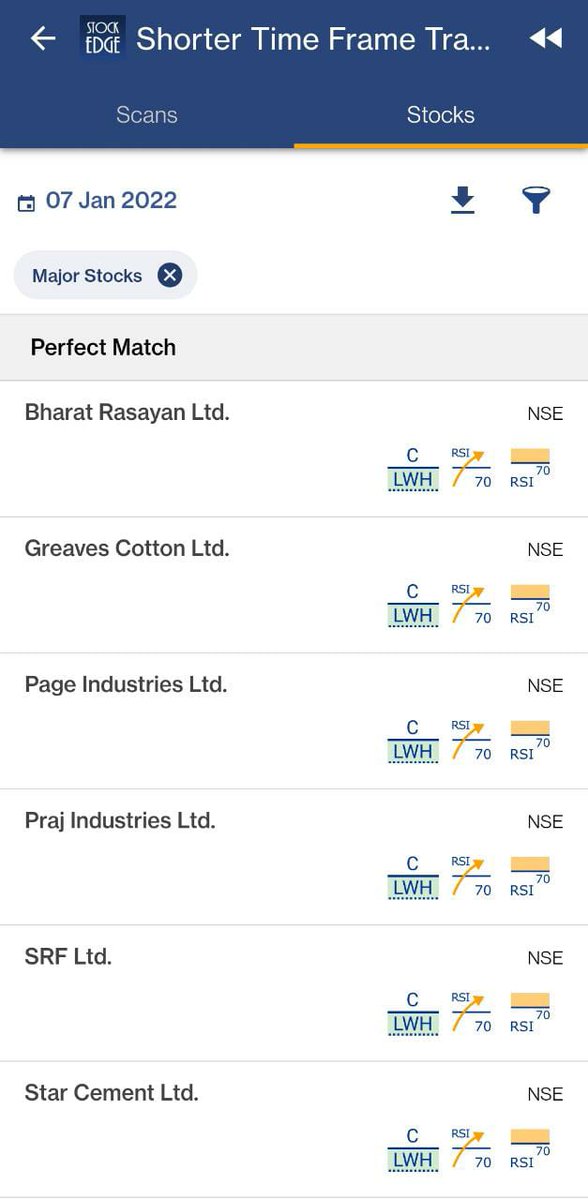
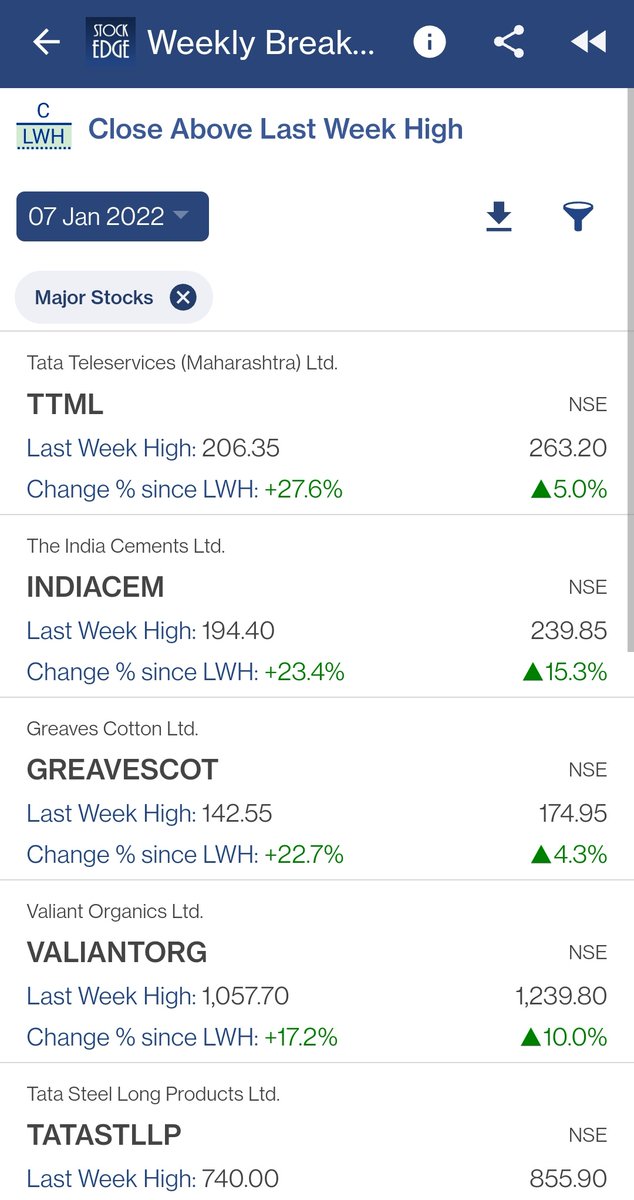
The first scan used here is Close Above Last Week High
https://t.co/ehv5ke8sxc
(3/7)
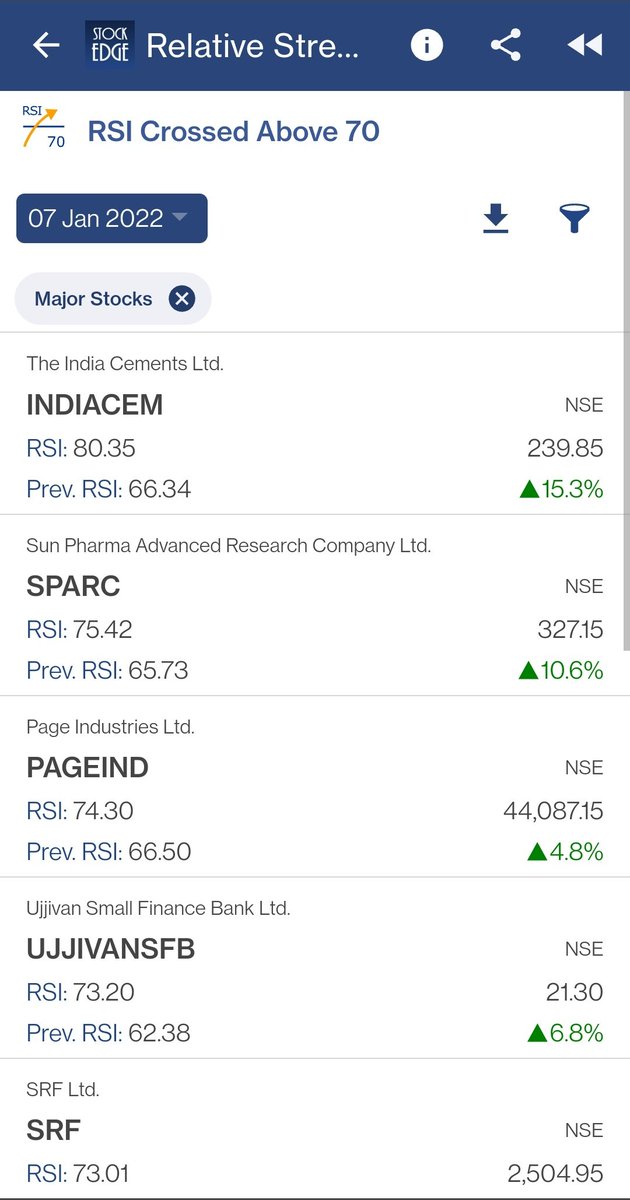
The Second Scan in the combo is RSI Crossed above 70 https://t.co/q4NpyFYuBD
(4/7)
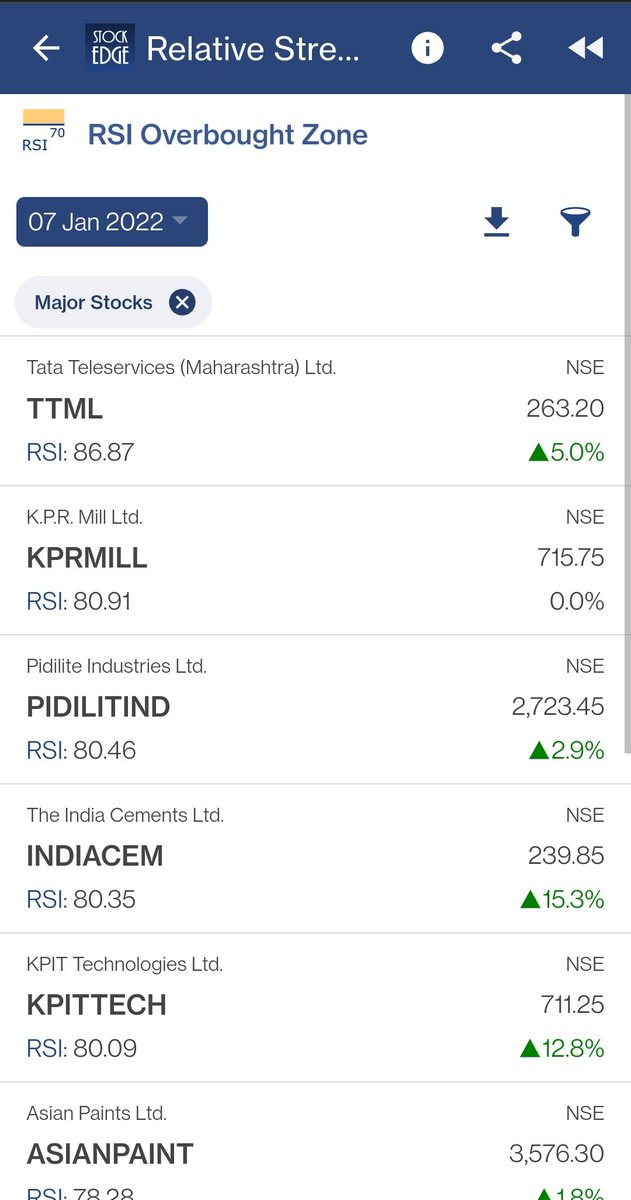
The Third Scan used here is RSI Overbought Zone https://t.co/5uZxwnLAUD
(5/7)
(🧵): https://t.co/6tUmyhrw47
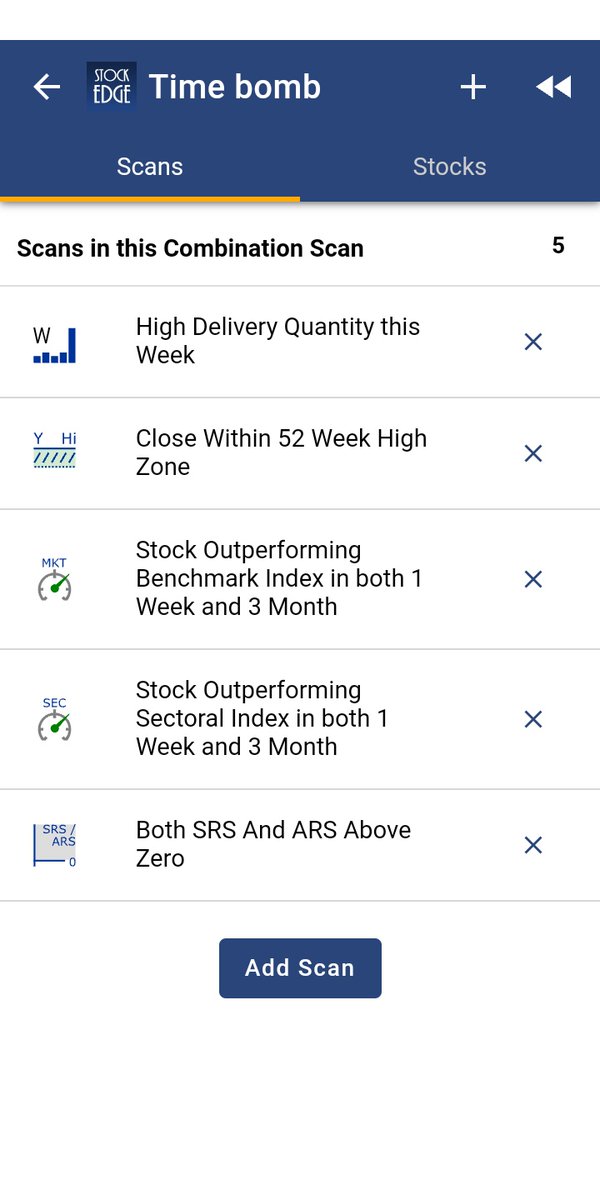
Stocks with a High Delivery, combined with a Close Within 52 week Zone are signs of strong momentum! https://t.co/arNYJst06d
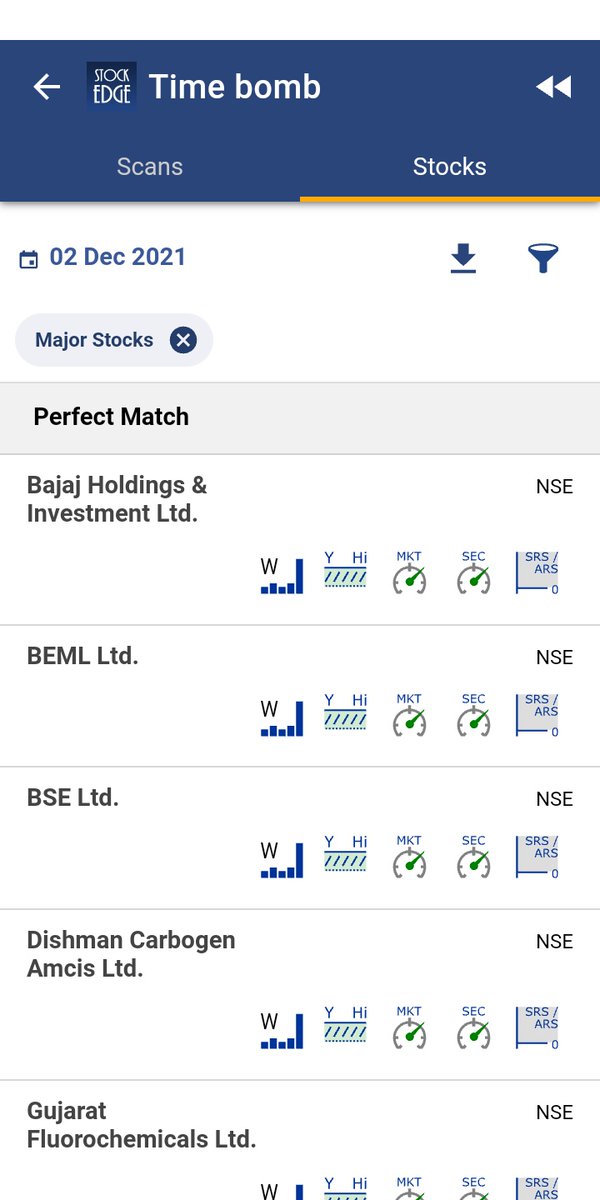
Relative Strength is a momentum indicator which signifies the ratio of a stock price performance compared to the market average performance:
Both Adaptive Relative Strength(ARS) and Static Relative Strength(SRS) above zero confirms its performance as better than Benchmark indexes!
Want to filter such stocks? Subscribe to StockEdge Premium and get these with a few clicks: https://t.co/5hmmLuqUFI
Use Code PREMIUM20 for 20% OFF!
More from Screeners


Step-by-step: how to use (the free) @screener_in to generate investment ideas.
Do retweet if you find it useful to benefit max investors. 🙏🙏
Ready or not, 🧵🧵⤵️

I will use the free screener version so that everyone can follow along.
Outline
1. Stepwise Guide
2. Practical Example: CoffeeCan Companies
3. Practical Example: Smallcap Consistent compounders
4. Practical Example: Smallcap turnaround
5. Key Takeaway
1. Stepwise Guide
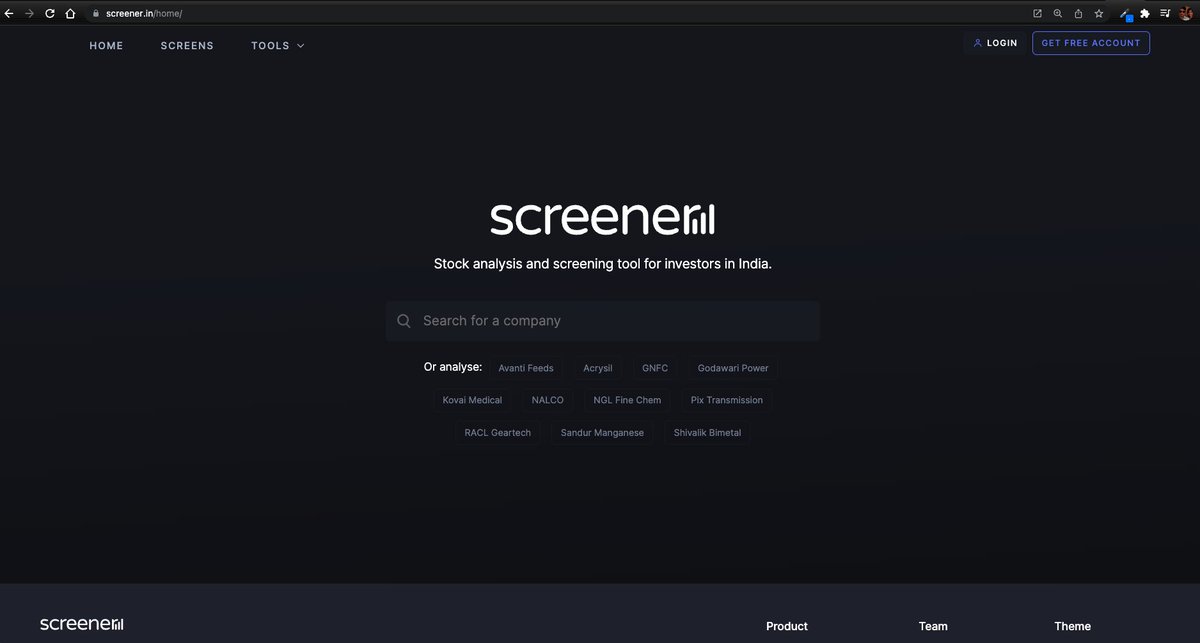
Step1
Go to https://t.co/jtOL2Bpoys
Step2
Go to "SCREENS" tab
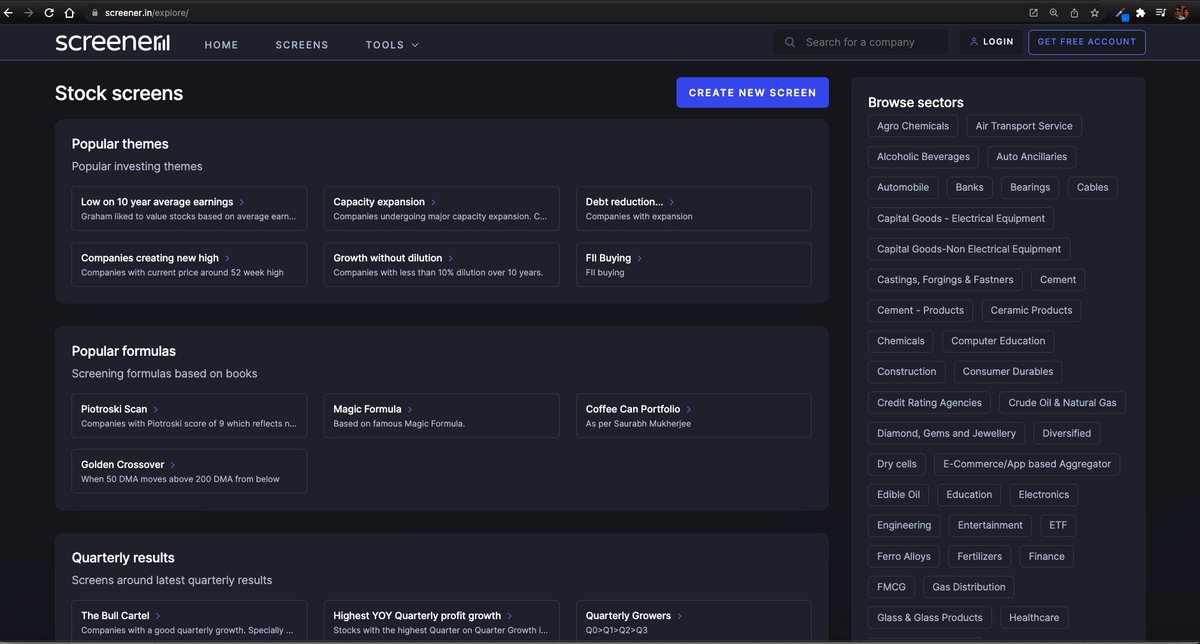
Step3
Go to "CREATE NEW SCREEN"
At this point you need to register. No charges. I did that with my brother's email id. This is what you see after that.


What does it mean?
7 tweets that will teach you about its basics (and much more):🧵
Collaborated with @niki_poojary
1/ What is CPR?
The basics of CPR, how it's calculated, and TC and BC in CPR.
User: @ZerodhaVarsity.
One can also gauge the trend whether bullish or bearish.
Explained in very simple words
@ZerodhaVarsity 2/ What are the Uses of CPR?
User: @YMehta_
A thread that provides examples along with the concept.
Also includes an Intraday Trading Setup on 5 min
#CPR is an indicator which is used for #Intraday in Stock Market.
— Yash Mehta (@YMehta_) November 19, 2021
This learning thread would be on
"\U0001d650\U0001d668\U0001d65a\U0001d668 \U0001d664\U0001d65b \U0001d63e\U0001d64b\U0001d64d"
Like\u2764\ufe0f& Retweet\U0001f501for wider reach and for more such learning thread in the future.
Also, an investment strategy is shared using CPR in the end.
1/24
@ZerodhaVarsity @YMehta_ 3/ How to analyze trends with CPR?
User: @cprbykgs
How to interpret CPR based on the candles forming either above or below the daily and weekly CPR.
He is the most famous guy when it comes to CPR, so go through his Twitter and Youtube
CPR indicator trend analysis:
— Gomathi Shankar (@cprbykgs) January 25, 2022
Candles below daily & weekly CPR \U0001f43b
Candles above daily CPR but below weekly CPR early confirmation of \U0001f402
Candles above daily + weekly CPR strong confirmation of \U0001f402
Isn\u2019t it simple?#cprbykgs #cprindicator #nifty #banknifty
@ZerodhaVarsity @YMehta_ @cprbykgs 4/ Interpreting longer timeframes with CPR
User: @cprbykgs
Trend Reversals with CPR when the trend is bullish and it enters the daily CPR
#banknifty
— Gomathi Shankar (@cprbykgs) July 9, 2021
Candles above monthly CPR- Bullish
Candles above weekly CPR- Bullish
Now, whenever candles enter daily CPR range it indicates weakness of current trend & early signs of trend reversal.
So, wait for the candles to exit the daily CPR range then take the trade. (1/4) pic.twitter.com/7vaaLMCrV8


You May Also Like


This New York Times feature shows China with a Gini Index of less than 30, which would make it more equal than Canada, France, or the Netherlands. https://t.co/g3Sv6DZTDE
That's weird. Income inequality in China is legendary.
Let's check this number.
2/The New York Times cites the World Bank's recent report, "Fair Progress? Economic Mobility across Generations Around the World".
The report is available here:
3/The World Bank report has a graph in which it appears to show the same value for China's Gini - under 0.3.
The graph cites the World Development Indicators as its source for the income inequality data.

4/The World Development Indicators are available at the World Bank's website.
Here's the Gini index: https://t.co/MvylQzpX6A
It looks as if the latest estimate for China's Gini is 42.2.
That estimate is from 2012.
5/A Gini of 42.2 would put China in the same neighborhood as the U.S., whose Gini was estimated at 41 in 2013.
I can't find the <30 number anywhere. The only other estimate in the tables for China is from 2008, when it was estimated at 42.8.