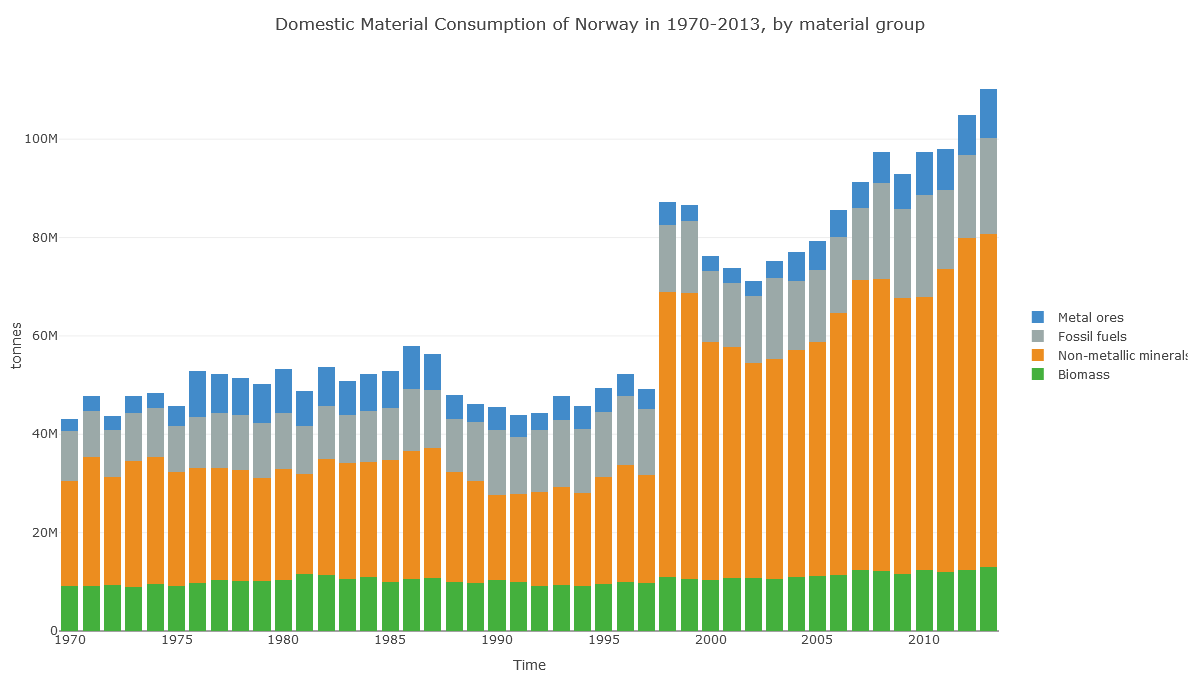
(Note also the jump in 1998, suggesting data problems.)
https://t.co/5QvzONbqmN


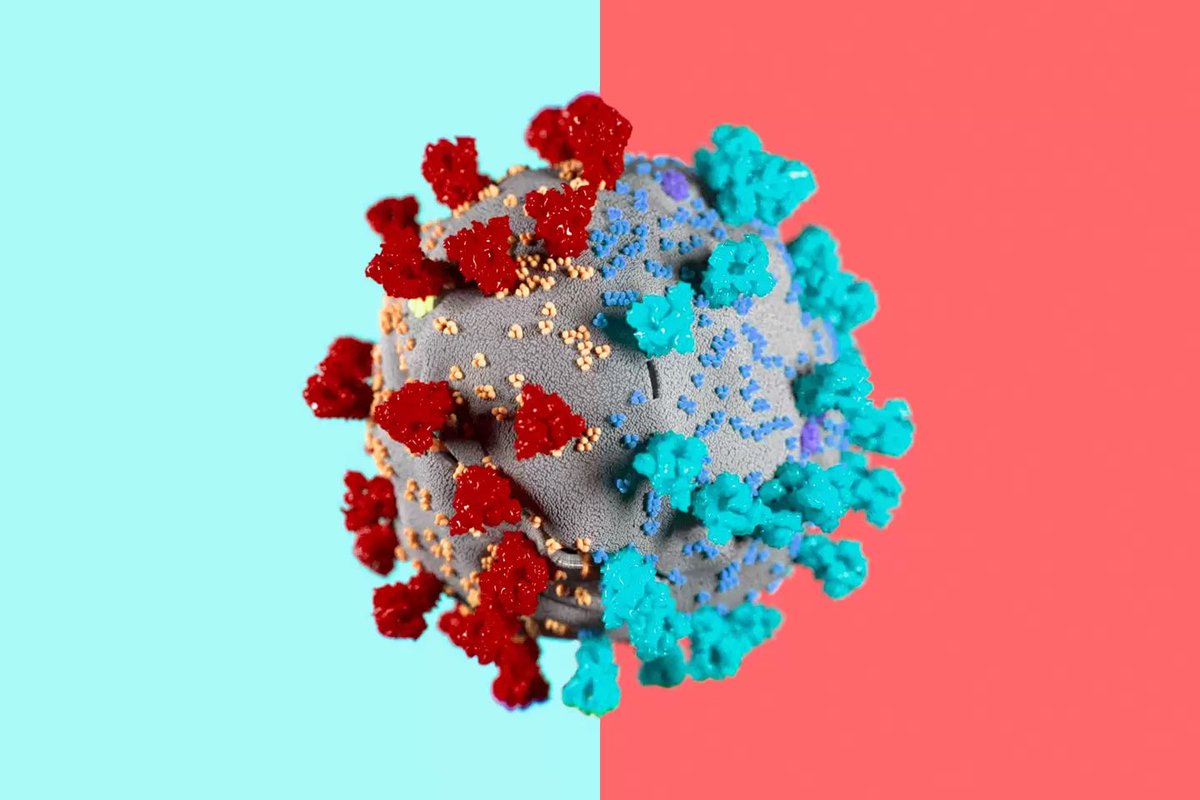
Immunocompromised 45 year old suffered from #COVID19 for 155 days before he died. The virus was changing very quickly inside the man's body\u2014it acquired a big cluster of >20 mutations\u2014resembled the same ones seen in #B117 & #B1351. (NPR audio Part 1 of 2)\U0001f9f5https://t.co/7kWiBZ1xGk pic.twitter.com/ZJ7AExB78Y
— Eric Feigl-Ding (@DrEricDing) February 8, 2021
2) NPR report audio part 2 of 2:
— Eric Feigl-Ding (@DrEricDing) February 8, 2021
Dr. Li couldn't believe what they found. "I was shocked," he says. "When I saw the virus sequences, I knew that we were dealing with something completely different and potentially very important." pic.twitter.com/HT3Yt6djFd
The new answer to a 77-year-old problem in data analysis, published today in @naturemethods. Instead of significance tests, use estimation graphics. Our software suite DABEST makes it easy for everyone to visualize effect sizes.https://t.co/UzwXJ7EUC5 pic.twitter.com/VtxyY0xaRM
— Adam Claridge-Chang (@adamcchang) June 19, 2019
Open letter to journal editors: dynamite plots must die. Dynamite plots, also known as bar and line graphs, hide important information. Editors should require authors to show readers the data and avoid these plots. https://t.co/0GNKEIUCJL pic.twitter.com/OS9ytEFRZN
— Rafael Irizarry (@rafalab) February 22, 2019
Couldn't find D3 code for grouped horisontal box plots that show data points so I made this @mbostock @thisisalfie https://t.co/cQjDPhyZdw pic.twitter.com/y6RNmDB2p3
— Ulrik Lyngs (@ulyngs) June 28, 2017
made a pkg for pirate plots in ggplot: add any of points/means/bars/CIs/violins \u2013 better than ye olde bar/box plotshttps://t.co/Z2m2kW3hsl pic.twitter.com/npAirPQexM
— Mika Braginsky (@mbraginsky) September 28, 2017
See the new #PowerBI visual awesomeness for data points & sources, box-&-whisker plots! https://t.co/dOmgoxWfDE pic.twitter.com/HAUOAMJEJW
— Microsoft Power BI (@MSPowerBI) February 1, 2016
If this is true raises the question of why certain (fringe & unethical) views got access to No.10 while others were ignored... https://t.co/A75HrSEqo4
— Prof. Devi Sridhar (@devisridhar) December 13, 2020
Focused Protection: The Middle Ground between Lockdowns and "Let-it-rip". An essay by Jay Bhattacharya (@Stanford), @SunetraGupta (@UniofOxford) and @MartinKulldorff (@Harvard). https://t.co/T8uLxSFwgh
— Martin Kulldorff (@MartinKulldorff) December 11, 2020
4/10
— Dr. Thomas Binder, MD (@Thomas_Binder) October 22, 2020
...indication, first of all that testing for a (single) respiratory virus is done outside of surveillance systems or need for specific therapy, but even so the lack of consideration of Ct, symptoms and clinical findings when interpreting its result. https://t.co/gHH6kwRdZG
6/10
— Dr. Thomas Binder, MD (@Thomas_Binder) October 22, 2020
The neither validated nor standardised hypersensitive RT-PCR test / Ct 35-45 for SARS-CoV-2 is abused to mislabel (also) other diseases, especially influenza, as COVID-19.https://t.co/AkFIfTCTkS
External peer review of the RTPCR test to detect SARS-CoV-2 reveals 10 major scientific flaws at the molecular and methodological level: consequences for false positive results.https://t.co/mbNY8bdw1p pic.twitter.com/OQBD4grMth
— Dr. Thomas Binder, MD (@Thomas_Binder) November 29, 2020
Thread web\u2b06\ufe0f\u2b07\ufe0f
— Dr. Thomas Binder, MD (@Thomas_Binder) December 16, 2020
The fabrication of the "asymptomatic (super) spreader" is the coronation of the total nons(ci)ense in the belief system of #CoronasWitnesses.
Asymptomatic transmission 0.7%; 95% CI 0%-4.9% - could well be 0%!https://t.co/VeZTzxXfvT
8/8
— Dr. Thomas Binder, MD (@Thomas_Binder) March 24, 2020
By the way, who the f*** created this obviously (almost) worldwide definition of #CoronaDeath?
This is not only medical malpractice, this is utterly insane!https://t.co/FFsTx4L2mw