The trunk and branches rep the tools & methodologies (Usul al- Fiqh/foundations of Fiqh & Maqasid/Objectives) used by scholars to derive the fruits (fatwas/rulings)
The halal polemics has begun … yet again!
Race and religious bigots will spin to trigger tension
Important to stick to the back of basics of Shari’ah (Islamic jurisprudence) & Research ethics
The relationship between Shari’ah and Fiqh is represented by a tree and its parts.
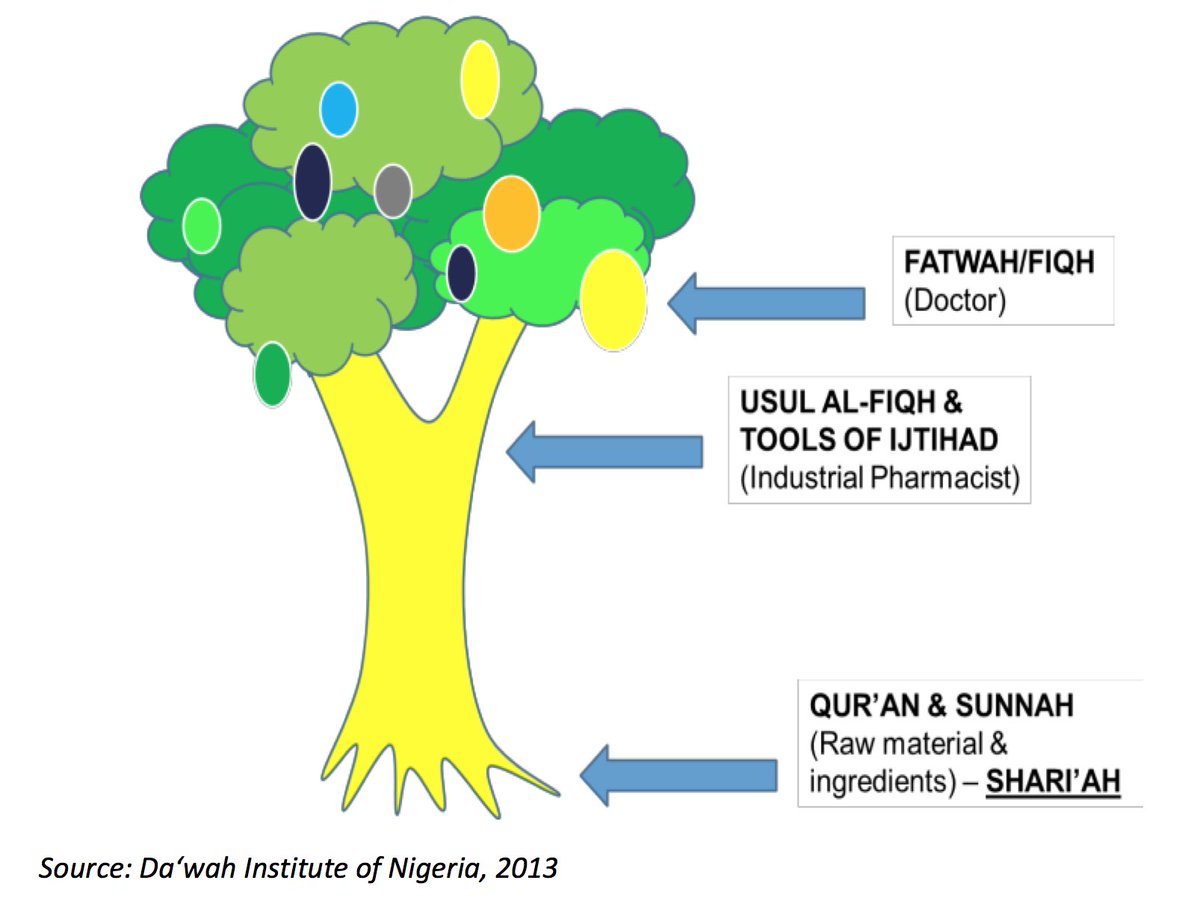
The trunk and branches rep the tools & methodologies (Usul al- Fiqh/foundations of Fiqh & Maqasid/Objectives) used by scholars to derive the fruits (fatwas/rulings)
The methodology & tools are how pharmacists process the raw ingredients into a medicine
The resulting medicine is dispensed by doctors.
It warrants an alternative prescription.
The relevance of a fatwa would dep on its quality, the societal context & its ability to effectively achieve Maqasid Shari’ah-bringing benefit (maslahah) or removing harm (mafsada).
Global-70 Million cases & 1.6 million deaths
M’sia-78K cases & 396 deaths
A #COVID19 vaccine is one of the solutions to end the pandemic apart from masking, distancing and hygiene
In the absence of clear textual evidence to the contrary everything is permissible
Permissibility (Halal) does not require textual evidence
To say any intervention is not allowed (Haram) requires textual evidence
The burden of proof that a medicine/vaccine/custom (mu’amalat) is impermissible falls on those who repudiate it, not on those who affirm it

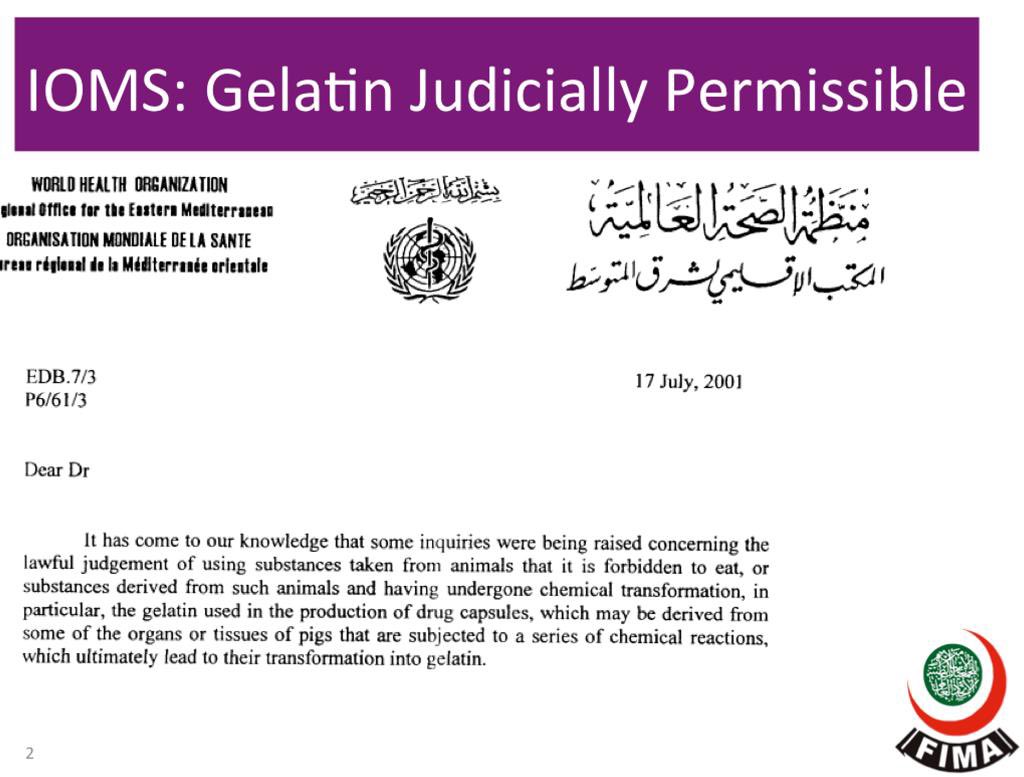
It was attended by > 100 Muslim religious scholars and medical experts.
Transformation (istihalah) is the conversion of a substance into another which is different in characteristics.
It changes substances that are judicially impure or are found in an impure environment into pure substances
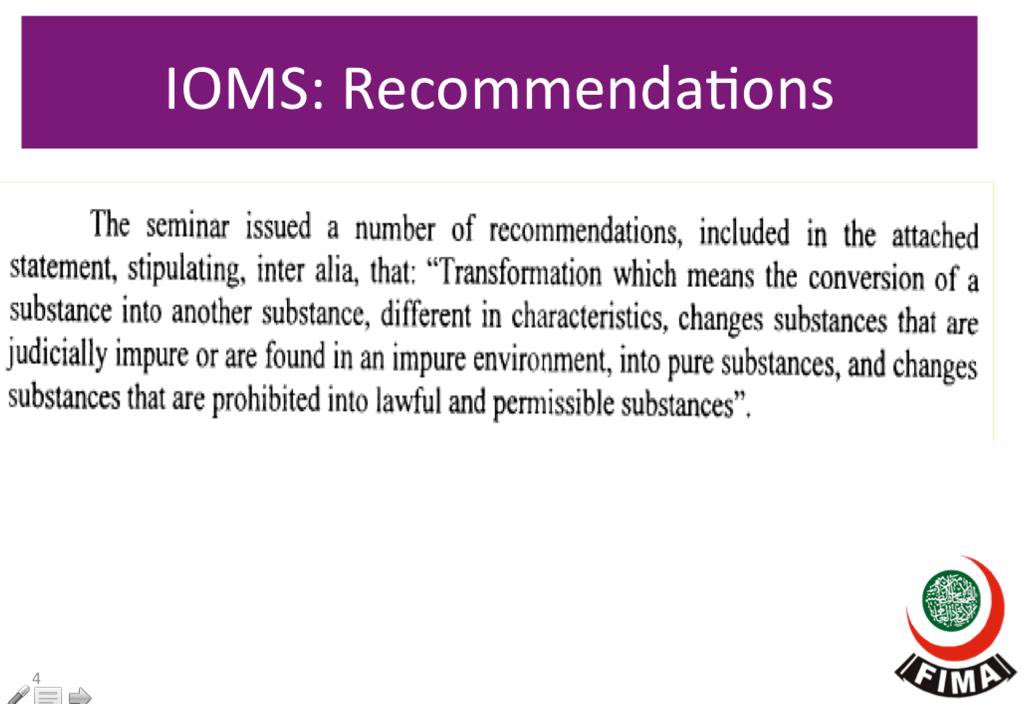
It changes substances that are prohibited into lawful and permitted substances

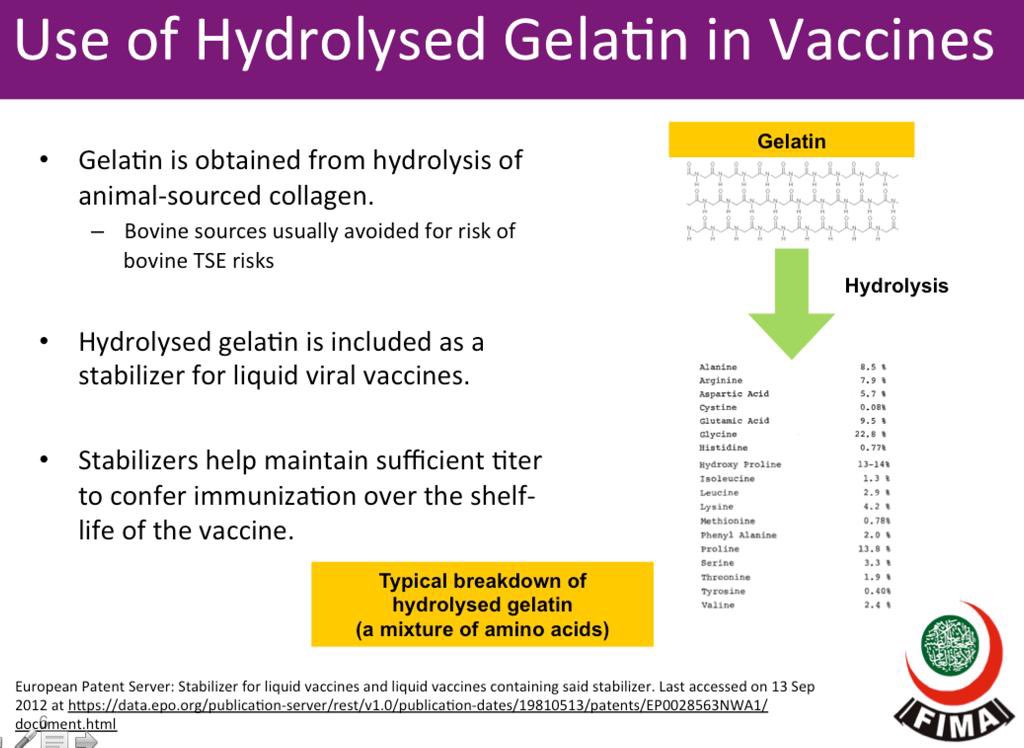
e.g. Gelatine in medicines, capsules, vaccines etc
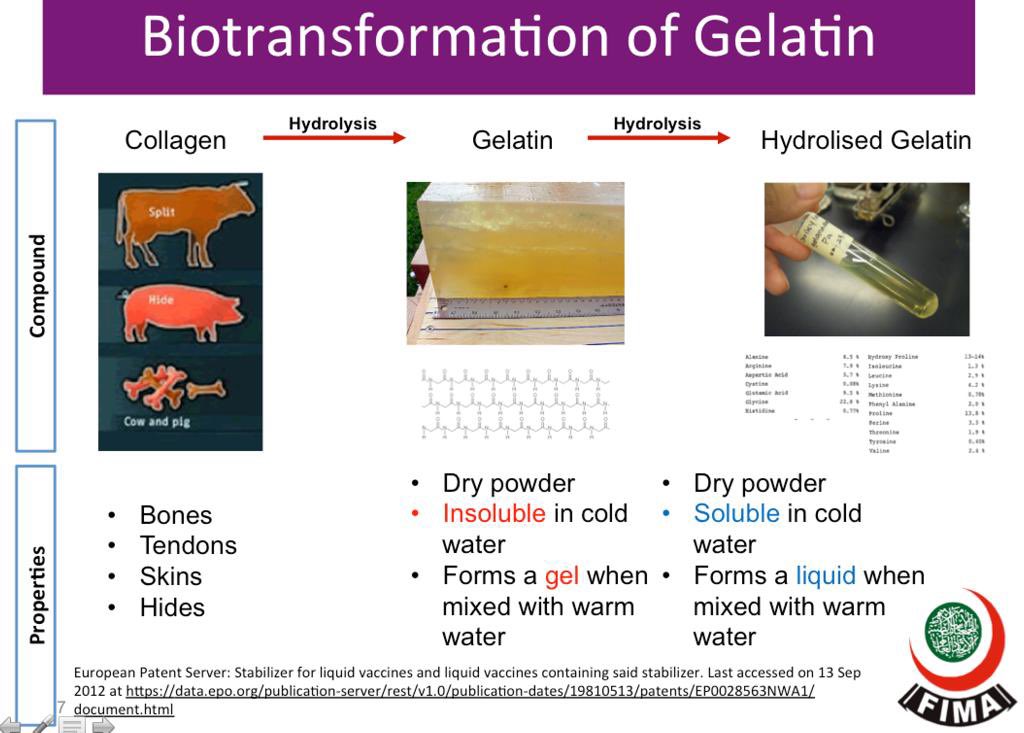
Gelatine is hydrolysed (transformed) into a mixture of amino acids which is not specie specific.
More from Science


Hi, I'm #MarvellousMarthy & this is a mini #GlobalScienceShow to celebrate @WomenScienceDay. I'd like to tell you about my STEM Role Model @MarineMumbles. Stick around for @philjemmett who’s up next. #WomenInSTEM #WomenInScience4SDGs #WomenInScience #girlsinSTEM
Go to https://t.co/fAM7lPSznm to watch my film. I love Rockpooling now as a hobby & I have got Mummy & Daddy into it too. I have learnt loads about marine life over the last year & Elizabeth @marinemumbles has shared her ❤️ of the oceans with me. I LOVE crabs 🦀 🦀🦀!!
This is Gem, Marthy’s Mummy. There have been so many other STEM women who have truly inspired #MarvellousMarthy over the past year: @DrJoScience has ignited a love of experiments, @ScienceAmbass has brought giggles with some fab experiment-alongs, @HanaAyboob for introducing her
to some amazing #SciArt, @BryonyMathew for releasing some fabulous books to help raise aspirations, @Astro_Nicole & @Victrix75 for allowing her to interview them as part of #worldspaceweek & @AmeliaJanePiper for the ongoing support since she won the SciComm presenter competition.
So, as you can tell from the film, Marthy adores Elizabeth & is truly inspired by her. Since engaging with her for the first time about 10 months ago, Marthy has developed a very keen & passionate interest for all things Marine! The @angleseyseazoo can vouch for this!!!!

"The new answer to a 77-year-old problem"
😭
https://t.co/hm9NoaU4nr
https://t.co/8fKDiKjSWc
https://t.co/jkaicC1F2x
https://t.co/PpxWT4Jef4
😭
The new answer to a 77-year-old problem in data analysis, published today in @naturemethods. Instead of significance tests, use estimation graphics. Our software suite DABEST makes it easy for everyone to visualize effect sizes.https://t.co/UzwXJ7EUC5 pic.twitter.com/VtxyY0xaRM
— Adam Claridge-Chang (@adamcchang) June 19, 2019
https://t.co/hm9NoaU4nr
Open letter to journal editors: dynamite plots must die. Dynamite plots, also known as bar and line graphs, hide important information. Editors should require authors to show readers the data and avoid these plots. https://t.co/0GNKEIUCJL pic.twitter.com/OS9ytEFRZN
— Rafael Irizarry (@rafalab) February 22, 2019
https://t.co/8fKDiKjSWc
Couldn't find D3 code for grouped horisontal box plots that show data points so I made this @mbostock @thisisalfie https://t.co/cQjDPhyZdw pic.twitter.com/y6RNmDB2p3
— Ulrik Lyngs (@ulyngs) June 28, 2017
https://t.co/jkaicC1F2x
made a pkg for pirate plots in ggplot: add any of points/means/bars/CIs/violins \u2013 better than ye olde bar/box plotshttps://t.co/Z2m2kW3hsl pic.twitter.com/npAirPQexM
— Mika Braginsky (@mbraginsky) September 28, 2017
https://t.co/PpxWT4Jef4
See the new #PowerBI visual awesomeness for data points & sources, box-&-whisker plots! https://t.co/dOmgoxWfDE pic.twitter.com/HAUOAMJEJW
— Microsoft Power BI (@MSPowerBI) February 1, 2016