💥💥 Situation Update, Dec. 7th – DNI John Ratcliffe, the bogus science of PCR testing and China’s GMO super soldiers
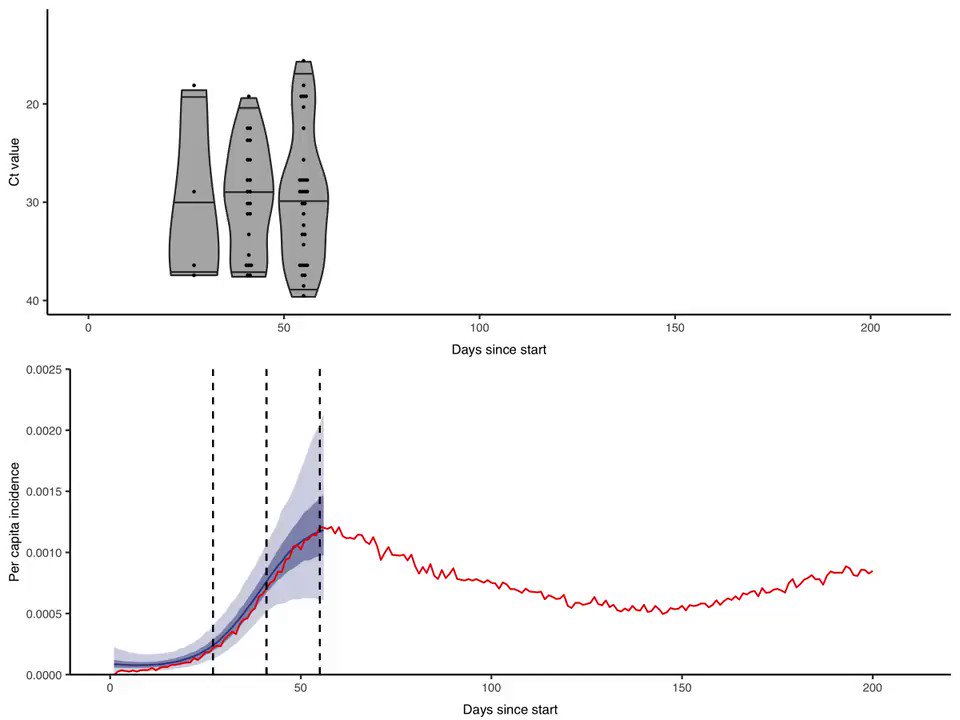
✅ I cover the bogus science behind PCR testing, explaining from a lab science point of view why no PCR instrument can “quantify” anything,
[M. Adams]
1. whether it’s a coronavirus viral load or the percentage of a food that’s GMO. In fact, literally all the tests currently conducted with PCR equipment are scientifically invalid when it comes to diagnosing illness or determining infectiousness. The sample acquisition used for
2. PCR tests — nasal swabs — aren’t even standardized! (100% bogus junk science).
After covering PCR tests, today’s update then goes into detail about Director of National Intelligence (DNI) John Ratcliffe, pointing out that he will be issuing a report on foreign interference
3. in U.S. elections on or before Dec. 18th. If this report confirms the existence of foreign interference that was capable of altering the outcome of the election, it gives President Trump full justification to declare the election null and void and dispatch military troops
4. to seize all ballots and hold a new count under military authority.
👉 Podcast notes and sources:
The office of military commissions has cleared its calendar for December:
https://t.co/u4nFRiUj8mUS military STOCKPILED Pfizer’s mRNA vaccineBEFORE it was approved by theFDA