Also, there are 3 strategies one may deploy according to their risk appetite:
1. Aggressive Traders (1.6%)
2. Moderate Risk Traders (0.93%)
3. Low-Risk Traders (0.6%)


A THREAD:
— Aditya Todmal (@AdityaTodmal) November 28, 2020
7 FREE OPTION TRADING COURSES FOR BEGINNERS.
Been getting lot of dm's from people telling me they want to learn option trading and need some recommendations.
Here I'm listing the resources every beginner should go through to shorten their learning curve.
(1/10)
The absolute best 15 scanners which experts are using.
— Aditya Todmal (@AdityaTodmal) January 29, 2021
Got these scanners from the following accounts:
1. @Pathik_Trader
2. @sanjufunda
3. @sanstocktrader
4. @SouravSenguptaI
5. @Rishikesh_ADX
Share for the benefit of everyone.
12 TRADING SETUPS which experts are using.
— Aditya Todmal (@AdityaTodmal) February 7, 2021
These setups I found from the following 4 accounts:
1. @Pathik_Trader
2. @sourabhsiso19
3. @ITRADE191
4. @DillikiBiili
Share for the benefit of everyone.
Curated tweets on How to Sell Straddles
— Aditya Todmal (@AdityaTodmal) February 21, 2021
Everything covered in this thread.
1. Management
2. How to initiate
3. When to exit straddles
4. Examples
5. Videos on Straddles
Share if you find this knowledgeable for the benefit of others.
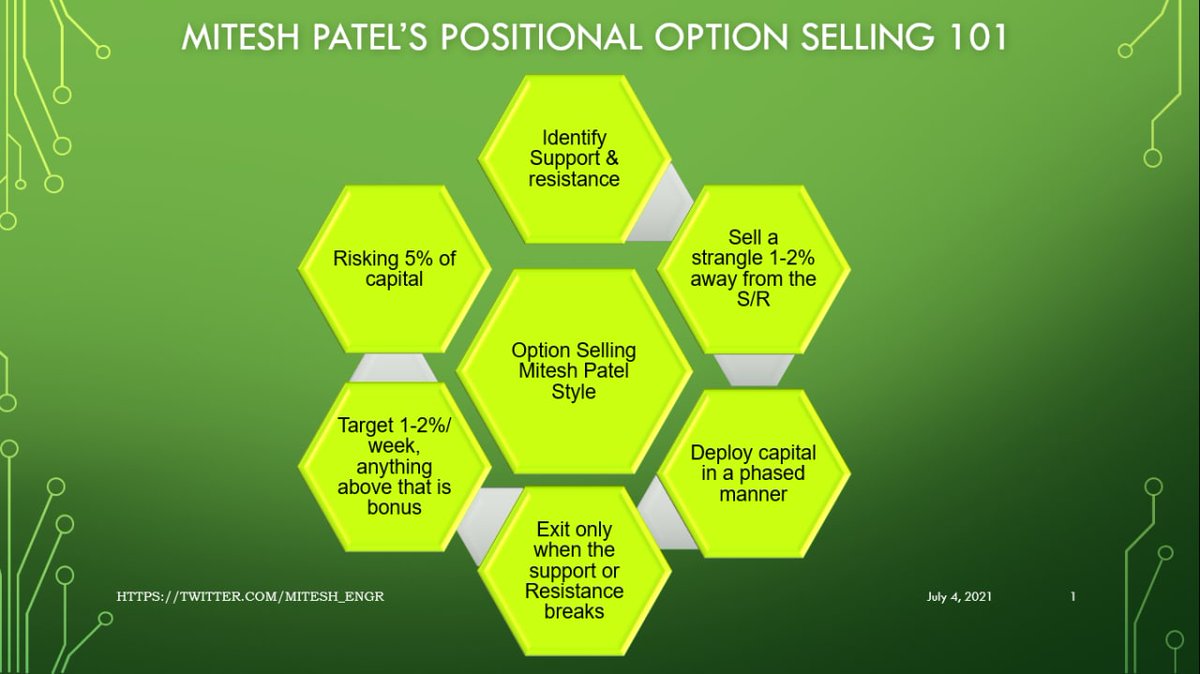
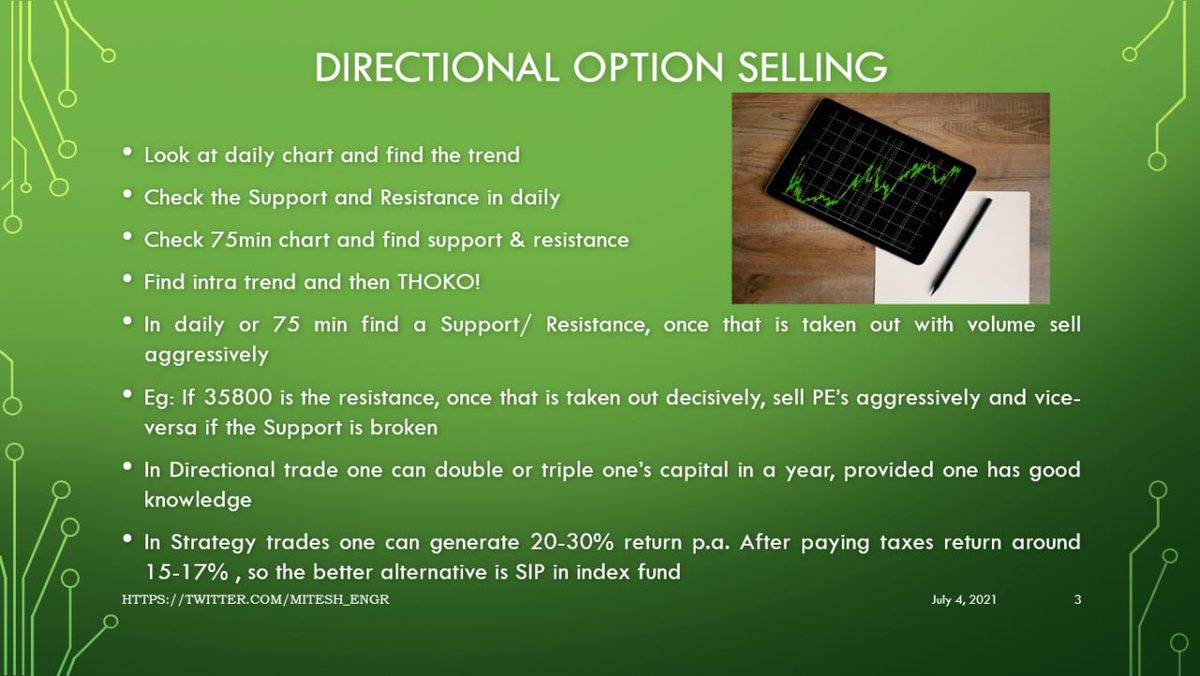
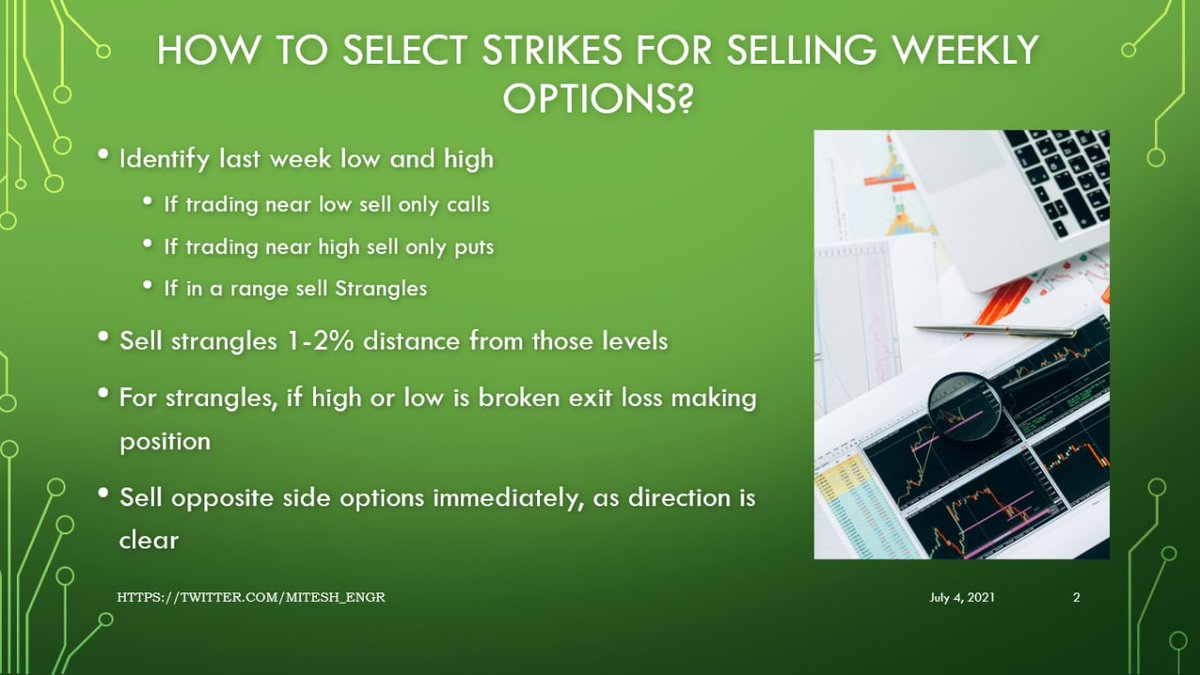
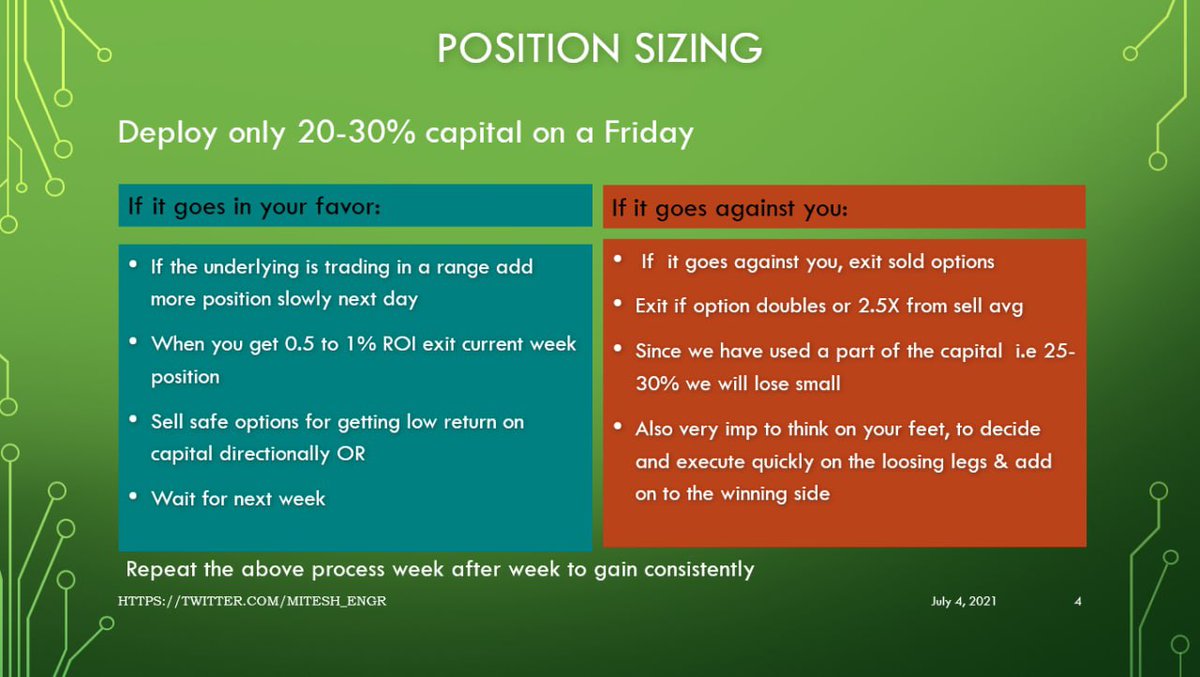
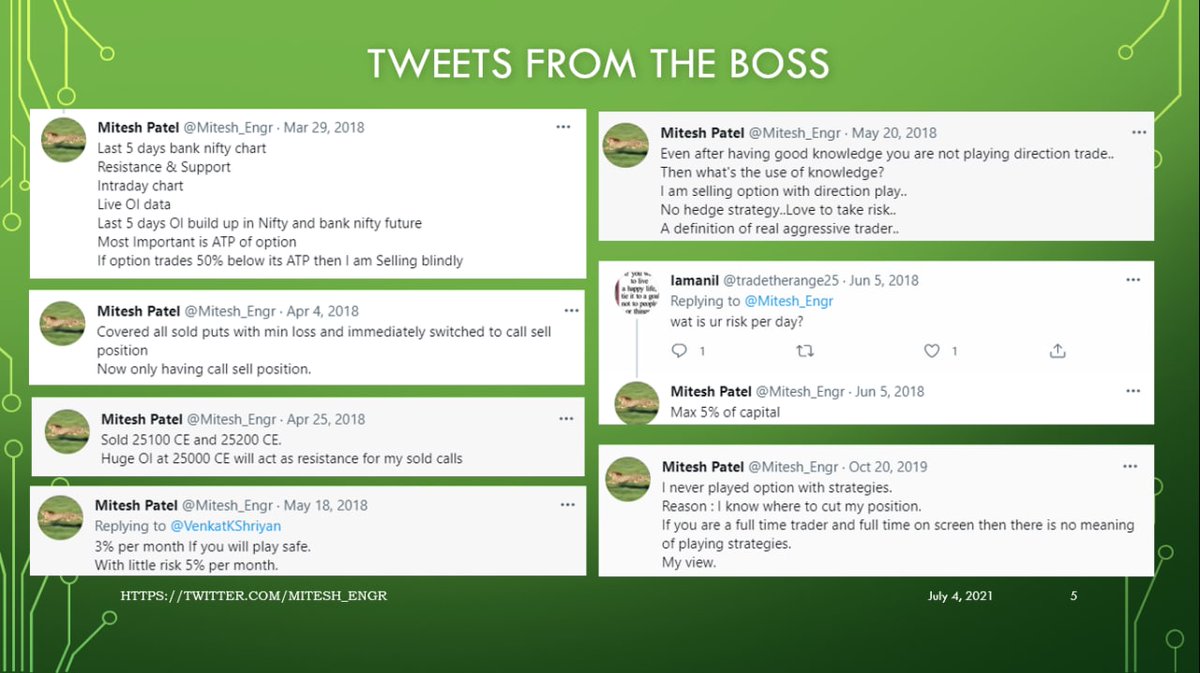
How to sell option?
— Mitesh Patel (@Mitesh_Engr) January 30, 2021
Here let me explain through simple math.
Say BN at 30000
30000 straddle trading at combine premium 800 ( based on current volatility)
Put at 400
Call at 400
You don\u2019t know direction. Sold both.
If move will not come than both will decrease gradually.
Screeners helps trader in saving lot of time in filtering best stocks out of 5000+ stocks listed.
— Yash Mehta (@YMehta_) October 28, 2022
Here is the list of top 10 Free Candlestick Pattern based screeners that I use:
Also, last two screeners are my favorite to pick early momentum stocks.
Screeners helps trader in saving lot of time in filtering best stocks out of 1000+ stocks listed.
— Yash Mehta (@YMehta_) September 16, 2022
Here is the list of top 9 Free Price Action based screeners that I use:
Also, last screener is my favorite to pick early momentum stocks.
Screeners helps trader in saving lot of time in filtering best stocks out of 5000+ listed stocks.
— Yash Mehta (@YMehta_) December 9, 2022
Here is the list of top 7 Free Strategy and its respective screeners that I use:
Also, last screener is my favorite to pick early momentum stocks.
There are so many investment strategies, still hardly anyone creates long term wealth in stocks.
— Yash Mehta (@YMehta_) November 25, 2022
Sharing 4 Investment Strategies based on Technical Analysis and Screeners for free (sold as a \u20b9 50,000 course!).
Shared a bonus trading strategy at the end.
A thread \U0001f9f5:
HCLTECH
— Pathik (@Pathik_Trader) March 31, 2021
WIPRO
M&M
TITAN
Adding into list
Remove AUROPHARMA, BHARTIARTL, TAMO from list (personal hate\U0001f603\U0001f603)
Why few traders are going bankrupt after attaining huge success.
— Mitesh Patel (@Mitesh_Engr) September 4, 2021
Could be the following psychology.
During initial days trader is generating huge ROI with less capital.
There are many strategies in market \U0001f4c9and it's possible to get monthly 4% return consistently if you master \U0001f4aain one strategy .
— Kavita (@Kavitastocks) September 4, 2021
One of those strategies which I like is Iron Fly\u2708\ufe0f
Few important points on Iron fly stategy
Here is the detailed information of about strategy,
— itrade(DJ) (@ITRADE191) September 4, 2021
Entry time : 9.30 - 10
Exit : Upto you
Strategy :
Sell weekly ATM CE & PE at almost equal price
For ex : Sell Nifty 17250 CE at 50 and Nifty 17250 PE at 48 so it will become short straddle
If it takes 15 Long Years (180+ months) to Build the First Crore Rupees, the Second will take a Few Years Lesser. The Third will be Effortless & The Fourth Happens Seamlessly.
— Fundamental Investor \u2122 \U0001f1ee\U0001f1f3 (@FI_InvestIndia) September 5, 2021
This is the Power of Patience, Base Effect & Compounding !!!#FI