#NMDC 178
Weekly chart
Seems to be forming a descending triangle. Better to wait for a breakout on the either side before taking any
More from Nishant Kumar
More from Nmdc

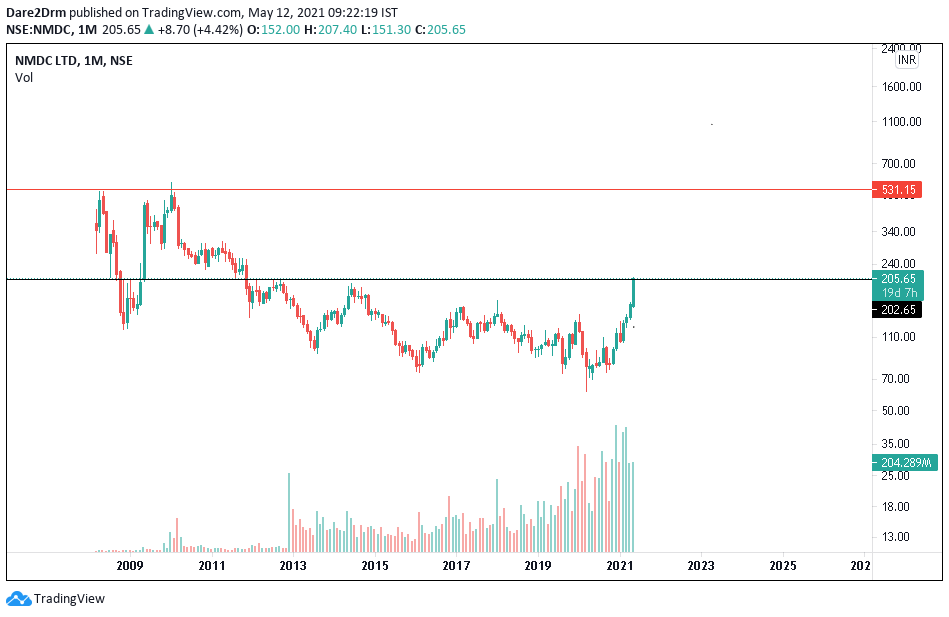

NMDC from 154 to 178..up 16%...next major resistance at 200
NMDC (cmp154) has broken 7 years of falling resistance line supply zone with strong volumes ...140 strong support zone looks good in short to medium term
— Ashish Chaturmohta (@AshishChatur) April 30, 2021
China is discouraging exports, looking to support domestic demand while restricting supply to reduce emissions. pic.twitter.com/lrfHdOiZXx
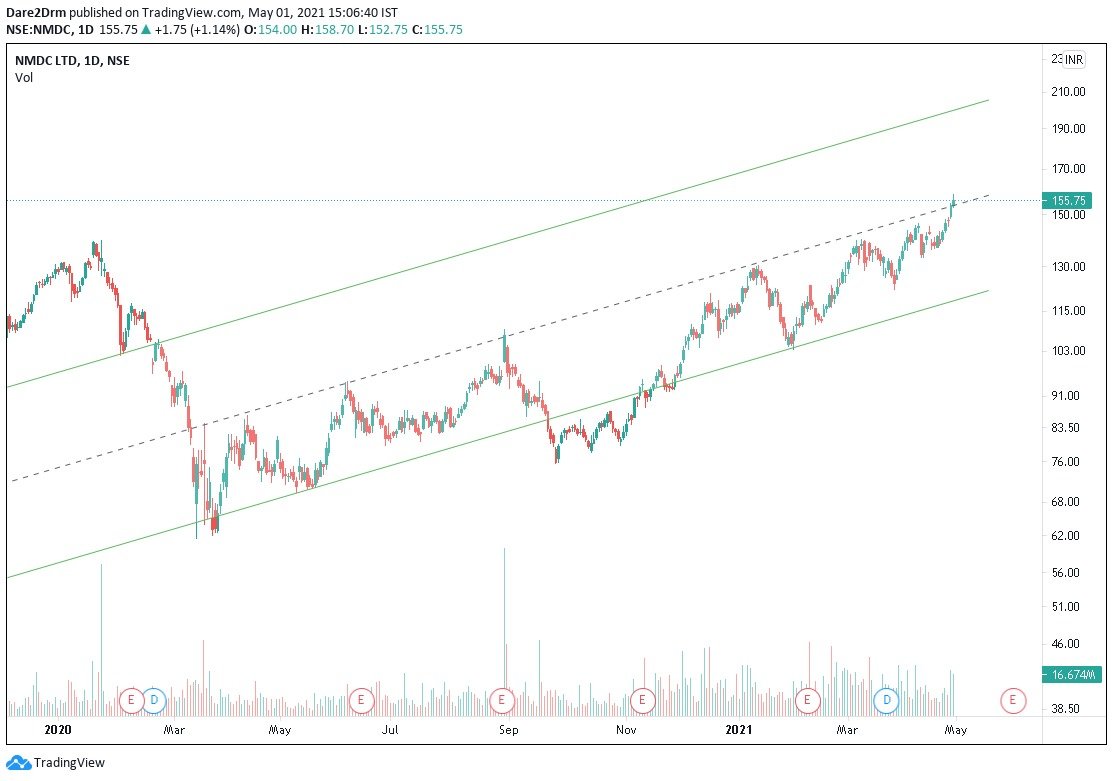
#NMDC the first targets done. 25% in one trading week. If the stocks breaks today low, watch out. A move above todays high - bigger targets open up.
#NMDC the stock is at supports. A clean break out above 160, this could do well. My stops on this one could be 148, if the break out get triggered#Dare2DRM #Watchlist pic.twitter.com/pGG7qj5IhP
— Dare2Dream (@Dare2Dr10109801) May 1, 2021


You May Also Like








Recently, the @CNIL issued a decision regarding the GDPR compliance of an unknown French adtech company named "Vectaury". It may seem like small fry, but the decision has potential wide-ranging impacts for Google, the IAB framework, and today's adtech. It's thread time! 👇
It's all in French, but if you're up for it you can read:
• Their blog post (lacks the most interesting details): https://t.co/PHkDcOT1hy
• Their high-level legal decision: https://t.co/hwpiEvjodt
• The full notification: https://t.co/QQB7rfynha
I've read it so you needn't!
Vectaury was collecting geolocation data in order to create profiles (eg. people who often go to this or that type of shop) so as to power ad targeting. They operate through embedded SDKs and ad bidding, making them invisible to users.
The @CNIL notes that profiling based off of geolocation presents particular risks since it reveals people's movements and habits. As risky, the processing requires consent — this will be the heart of their assessment.
Interesting point: they justify the decision in part because of how many people COULD be targeted in this way (rather than how many have — though they note that too). Because it's on a phone, and many have phones, it is considered large-scale processing no matter what.
It's all in French, but if you're up for it you can read:
• Their blog post (lacks the most interesting details): https://t.co/PHkDcOT1hy
• Their high-level legal decision: https://t.co/hwpiEvjodt
• The full notification: https://t.co/QQB7rfynha
I've read it so you needn't!
Vectaury was collecting geolocation data in order to create profiles (eg. people who often go to this or that type of shop) so as to power ad targeting. They operate through embedded SDKs and ad bidding, making them invisible to users.
The @CNIL notes that profiling based off of geolocation presents particular risks since it reveals people's movements and habits. As risky, the processing requires consent — this will be the heart of their assessment.
Interesting point: they justify the decision in part because of how many people COULD be targeted in this way (rather than how many have — though they note that too). Because it's on a phone, and many have phones, it is considered large-scale processing no matter what.