
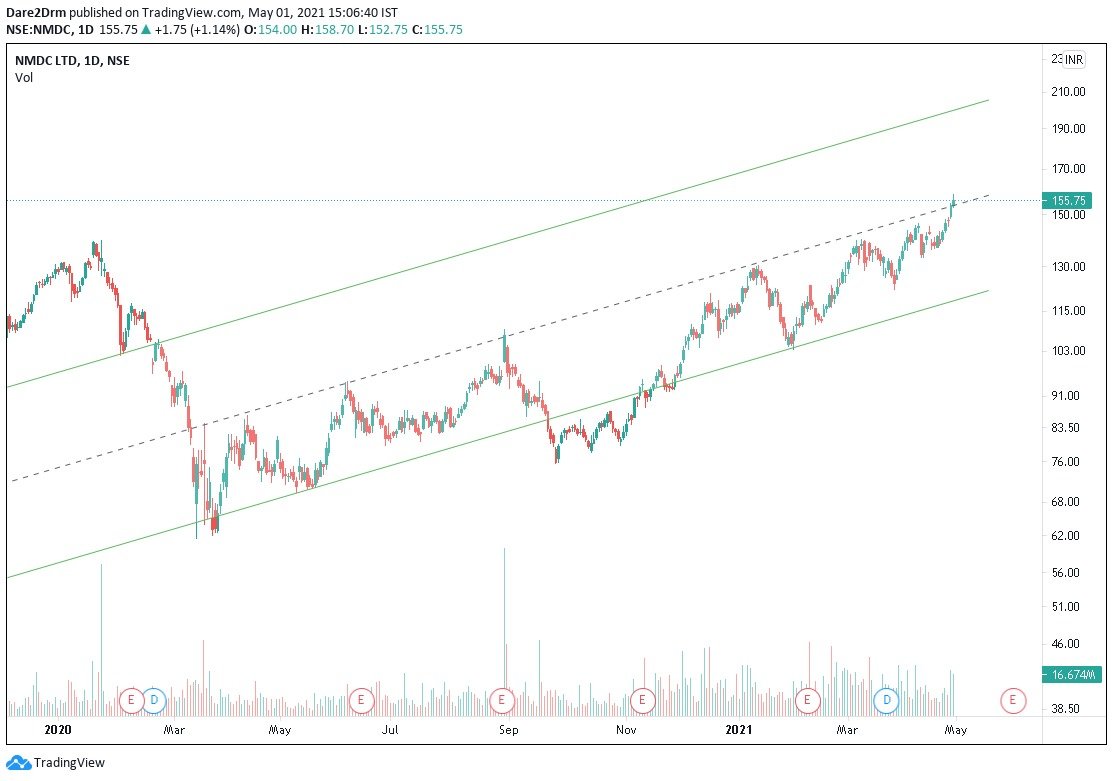
#NMDC the stock is at supports. A clean break out above 160, this could do well. My stops on this one could be 148, if the break out get triggered
#Dare2DRM #Watchlist
More from Dare2Dream

#MothersonSumi above 241, the stock could head to previous ATH around 260 levels. Beyond that bigger targets open up. In my view, the stock has resumed its next up trend. https://t.co/mG4Q0N1lyL
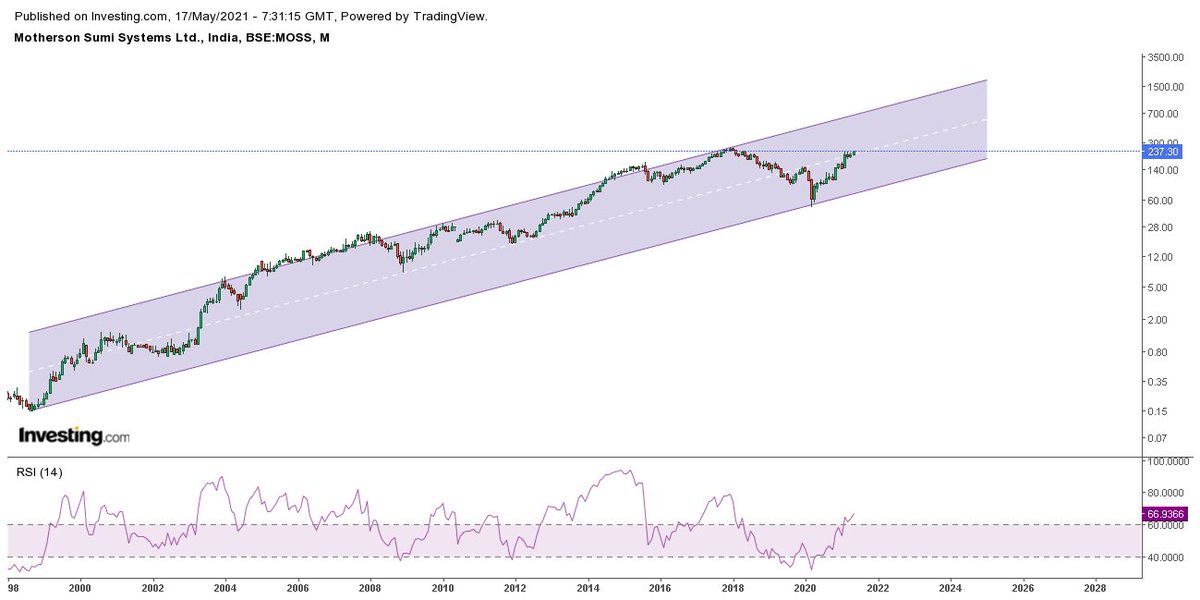
#MothersonSumi Breaking out@caniravkaria pic.twitter.com/lpcR1J8r7H
— Dare2Dream (@Dare2Dr10109801) May 12, 2021
#Indiamart update - Above 7420, this one could rock - keep an eye. Narrow consolidation in price and time https://t.co/rkwehCnNY8

#Indiamart Update : The correction in the stock could be over. Stock holding good supports. Watch for upside momentum as #Unlock plays out. My SL here would be 6650 levels#Dare2Drm pic.twitter.com/JLwujVPcl0
— Dare2Dream (@Dare2Dr10109801) June 13, 2021
More from Nmdc
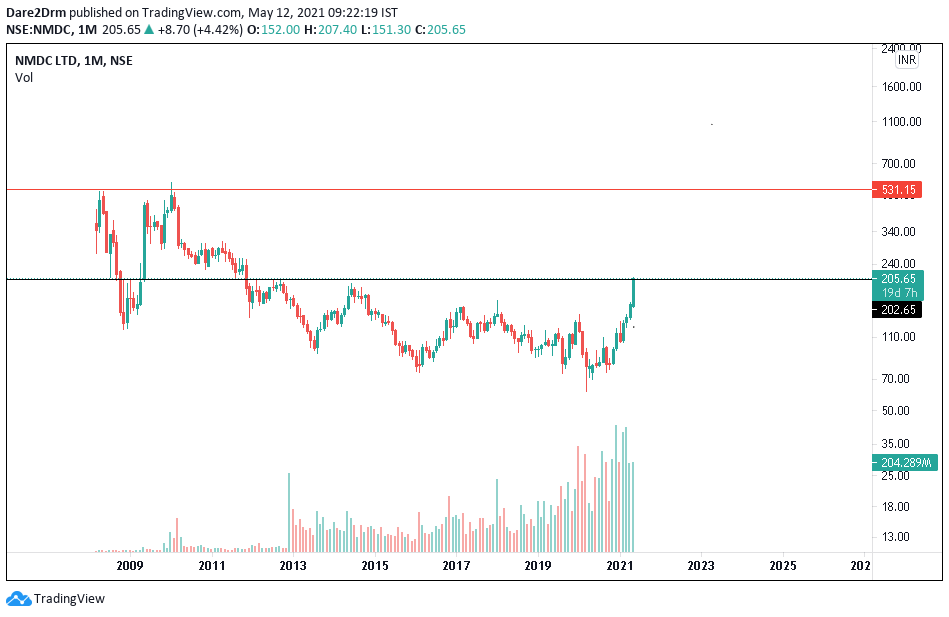


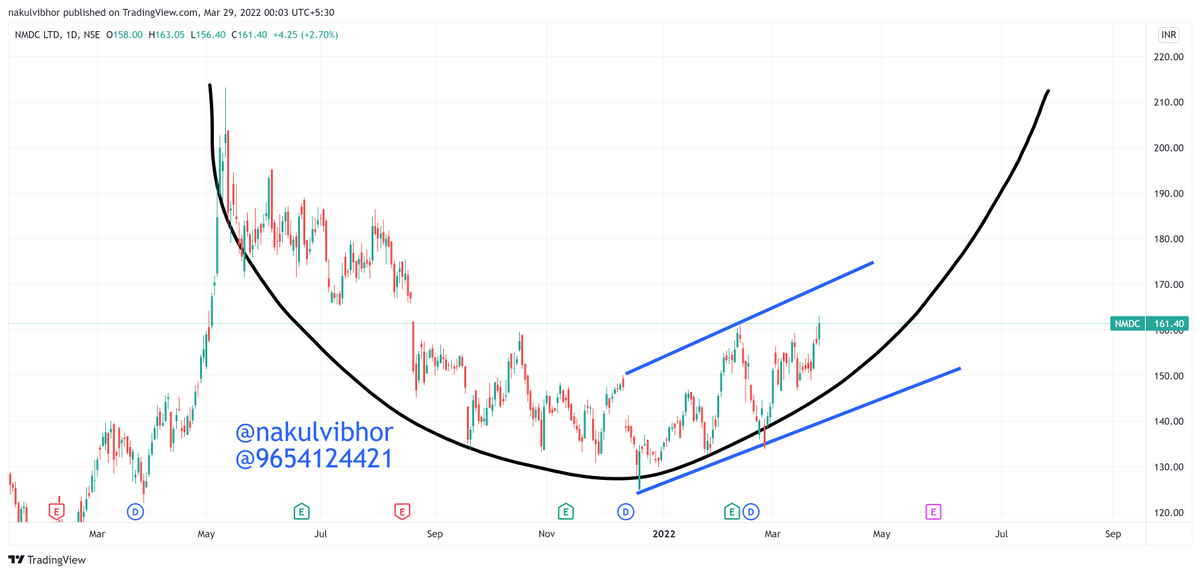


NMDC from 154 to 178..up 16%...next major resistance at 200
NMDC (cmp154) has broken 7 years of falling resistance line supply zone with strong volumes ...140 strong support zone looks good in short to medium term
— Ashish Chaturmohta (@AshishChatur) April 30, 2021
China is discouraging exports, looking to support domestic demand while restricting supply to reduce emissions. pic.twitter.com/lrfHdOiZXx
You May Also Like


1/OK, data mystery time.
This New York Times feature shows China with a Gini Index of less than 30, which would make it more equal than Canada, France, or the Netherlands. https://t.co/g3Sv6DZTDE
That's weird. Income inequality in China is legendary.
Let's check this number.
2/The New York Times cites the World Bank's recent report, "Fair Progress? Economic Mobility across Generations Around the World".
The report is available here:
3/The World Bank report has a graph in which it appears to show the same value for China's Gini - under 0.3.
The graph cites the World Development Indicators as its source for the income inequality data.

4/The World Development Indicators are available at the World Bank's website.
Here's the Gini index: https://t.co/MvylQzpX6A
It looks as if the latest estimate for China's Gini is 42.2.
That estimate is from 2012.
5/A Gini of 42.2 would put China in the same neighborhood as the U.S., whose Gini was estimated at 41 in 2013.
I can't find the <30 number anywhere. The only other estimate in the tables for China is from 2008, when it was estimated at 42.8.
This New York Times feature shows China with a Gini Index of less than 30, which would make it more equal than Canada, France, or the Netherlands. https://t.co/g3Sv6DZTDE
That's weird. Income inequality in China is legendary.
Let's check this number.
2/The New York Times cites the World Bank's recent report, "Fair Progress? Economic Mobility across Generations Around the World".
The report is available here:
3/The World Bank report has a graph in which it appears to show the same value for China's Gini - under 0.3.
The graph cites the World Development Indicators as its source for the income inequality data.
4/The World Development Indicators are available at the World Bank's website.
Here's the Gini index: https://t.co/MvylQzpX6A
It looks as if the latest estimate for China's Gini is 42.2.
That estimate is from 2012.
5/A Gini of 42.2 would put China in the same neighborhood as the U.S., whose Gini was estimated at 41 in 2013.
I can't find the <30 number anywhere. The only other estimate in the tables for China is from 2008, when it was estimated at 42.8.