#ITC gave an opportunity to pyramid today.
Intraday and daily charts.
It was a momentum stock today (intra-day) and at EOD also
Stock is in super bullish mode https://t.co/aZOyXvw2tQ
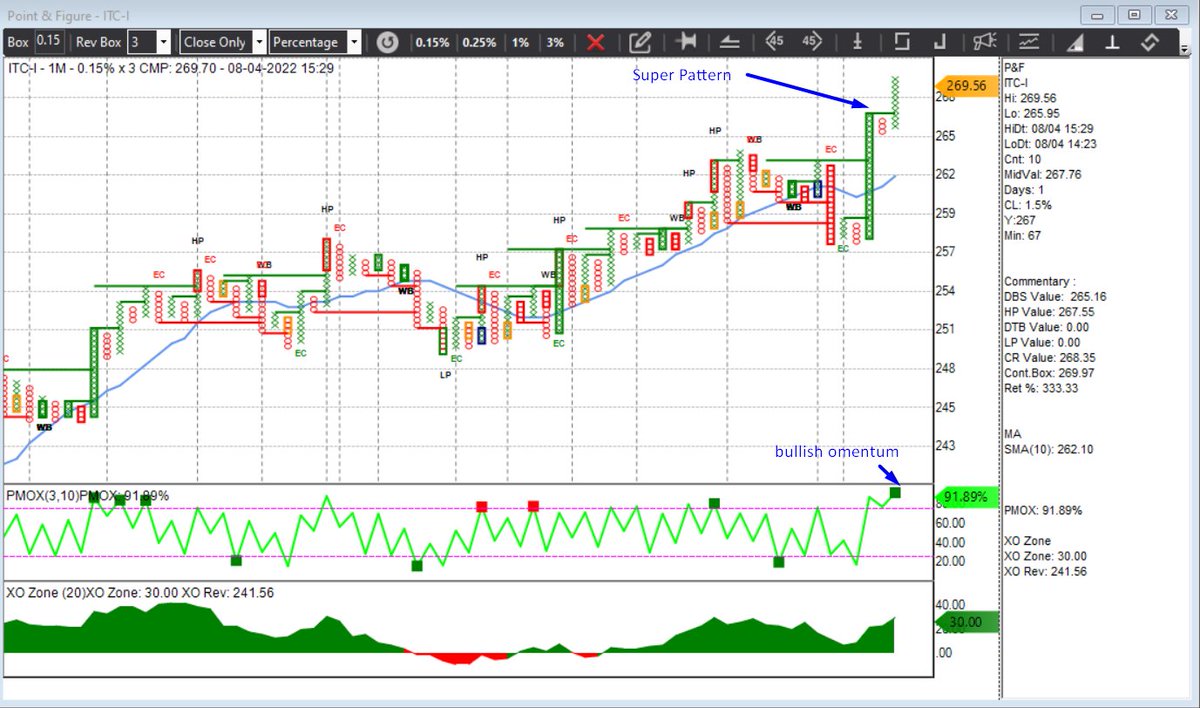
What's the PF chart says about ITC?
— Growth Builder (@KETANPA50636298) April 8, 2022
More from DTBhat


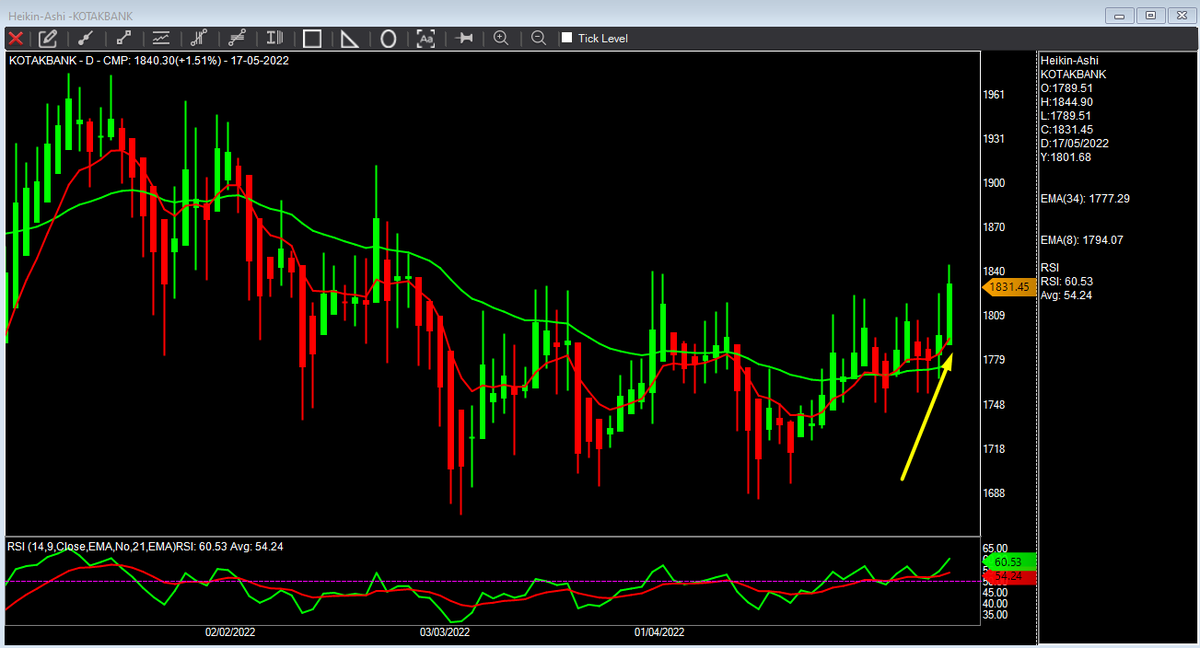


More from Itc

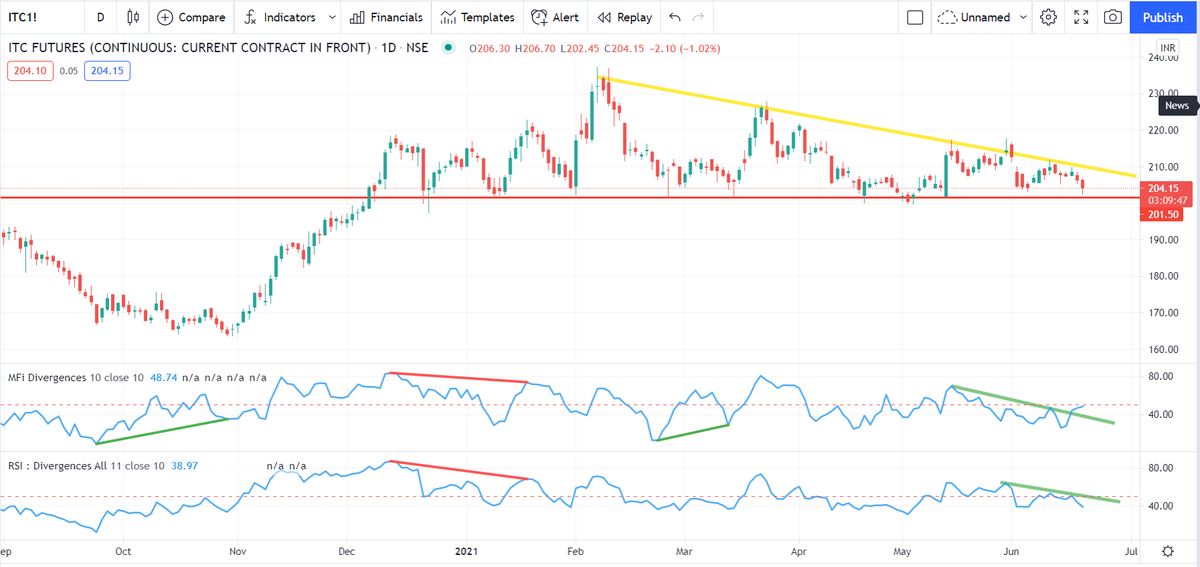

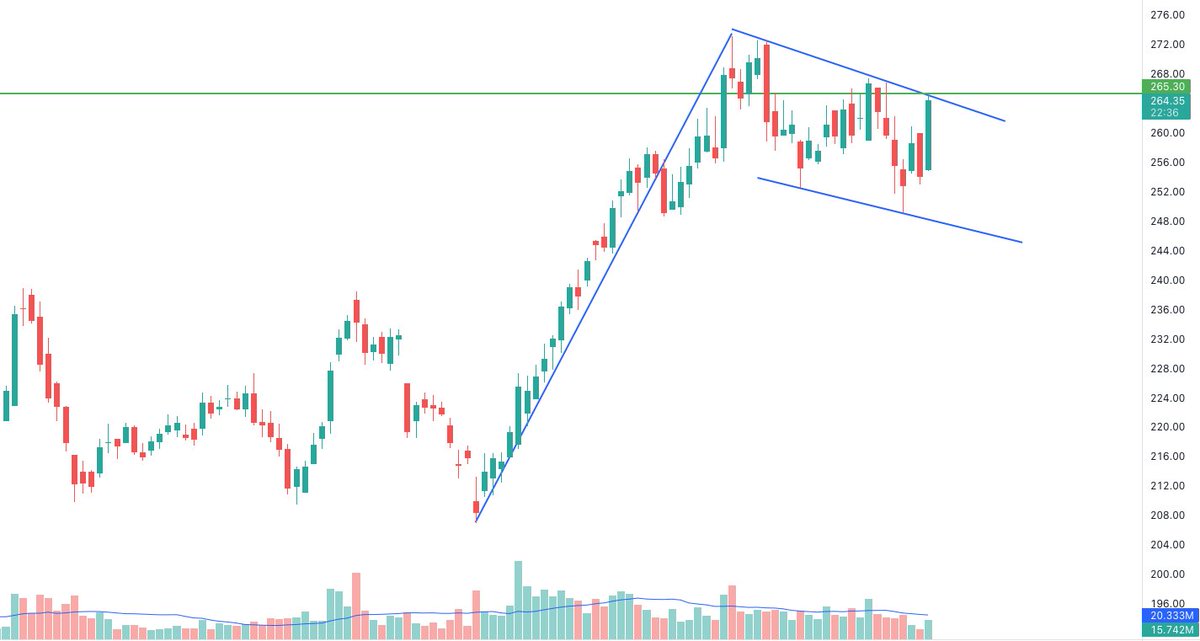

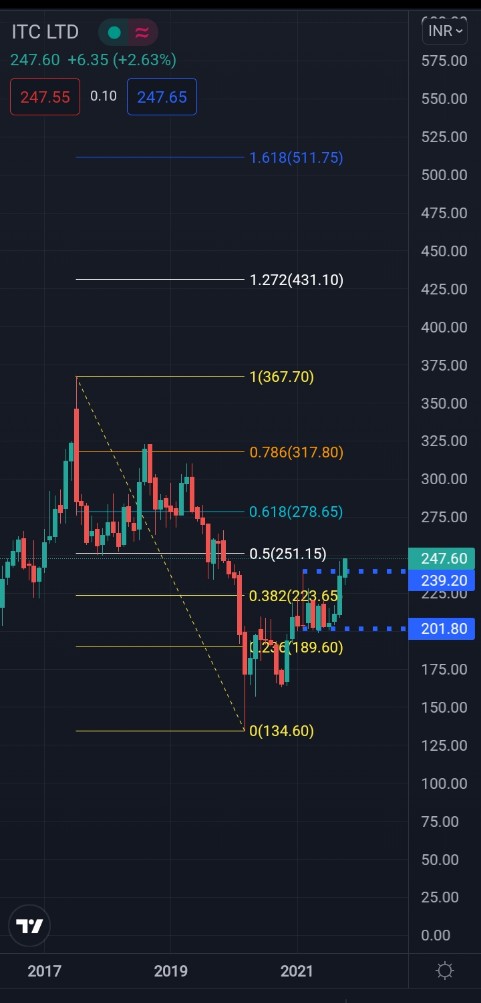


#ITC Is this last leg of downside or game over?🙆
Key points : 👇
~ RSI breakout retest in weekly chart
~ HH &HL pattern ,Price action still bullish
~ Huge support as per ratio chart.
#CNXFMCG #Nifty
Key points : 👇
~ RSI breakout retest in weekly chart
~ HH &HL pattern ,Price action still bullish
~ Huge support as per ratio chart.
#CNXFMCG #Nifty
#ITC I drilled further by #CNXFMCG index
— Pranay Prasun (@PranayPrasun) July 3, 2021
Keypoints :
~ Near huge support as per weekly chart
~ #RSI Breakout retest #Ratiochart
Conclusion : Bounceback expected
Timeframe : Weekly , So please avoid daily movement .@piyushchaudhry @gogrithekhabri @Deishma @pratyush_rohit https://t.co/PKbi7mdoam pic.twitter.com/MUWBSX2LlB
You May Also Like


"I really want to break into Product Management"
make products.
"If only someone would tell me how I can get a startup to notice me."
Make Products.
"I guess it's impossible and I'll never break into the industry."
MAKE PRODUCTS.
Courtesy of @edbrisson's wonderful thread on breaking into comics – https://t.co/TgNblNSCBj – here is why the same applies to Product Management, too.
There is no better way of learning the craft of product, or proving your potential to employers, than just doing it.
You do not need anybody's permission. We don't have diplomas, nor doctorates. We can barely agree on a single standard of what a Product Manager is supposed to do.
But – there is at least one blindingly obvious industry consensus – a Product Manager makes Products.
And they don't need to be kept at the exact right temperature, given endless resource, or carefully protected in order to do this.
They find their own way.
make products.
"If only someone would tell me how I can get a startup to notice me."
Make Products.
"I guess it's impossible and I'll never break into the industry."
MAKE PRODUCTS.
Courtesy of @edbrisson's wonderful thread on breaking into comics – https://t.co/TgNblNSCBj – here is why the same applies to Product Management, too.
"I really want to break into comics"
— Ed Brisson (@edbrisson) December 4, 2018
make comics.
"If only someone would tell me how I can get an editor to notice me."
Make Comics.
"I guess it's impossible and I'll never break into the industry."
MAKE COMICS.
There is no better way of learning the craft of product, or proving your potential to employers, than just doing it.
You do not need anybody's permission. We don't have diplomas, nor doctorates. We can barely agree on a single standard of what a Product Manager is supposed to do.
But – there is at least one blindingly obvious industry consensus – a Product Manager makes Products.
And they don't need to be kept at the exact right temperature, given endless resource, or carefully protected in order to do this.
They find their own way.