
Charles Walker, Vice Chair of the 1922 Tory backbench committee in the Commons tells TWTW that he thinks the government knew it intended to “cancel” Christmas on Wednesday or Thursday but waited for Parliament to rise to do it. Says many of his colleagues find this “egregious.”
Reminder- Charles Walker is Vice Chair of the Tory backbench committee.
No, it was very human behaviour- well within the law- by people who probably faced Christmas alone and had been bounced into travelling en masse because of the midnight deadline. https://t.co/jJtNnAN6DM
— William Wragg MP (@William_Wragg) December 20, 2020
More from Lewis Goodall
More from Government



The Government is making the same mistakes as it did in the first wave. Except with knowledge.
A thread.
The Government's strategy at the beginning of the pandemic was to 'cocoon' the vulnerable (e.g. those in care homes). This was a 'herd immunity' strategy. This interview is from
This strategy failed. It is impossible to 'cocoon' the vulnerable, as Covid is passed from younger people to older, more vulnerable people.
We can see this playing out through heatmaps. e.g. these heatmaps from the second
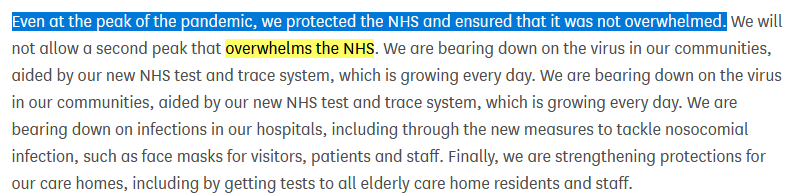
The Government then decided to change its strategy to 'preventing a second wave that overwhelms the NHS'. This was announced on 8 June in Parliament.
This is not the same as 'preventing a second wave'.
https://t.co/DPWiJbCKRm
The Academy of Medical Scientists published a report on 14 July 'Preparing for a Challenging Winter' commissioned by the Chief Scientific Adviser that set out what needed to be done in order to prevent a catastrophe over the winter
A thread.
The Government's strategy at the beginning of the pandemic was to 'cocoon' the vulnerable (e.g. those in care homes). This was a 'herd immunity' strategy. This interview is from
Government #coronavirus science advisor Dr David Halpern tells me of plans to \u2018cocoon\u2019 vulnerable groups. pic.twitter.com/dhECJNbmnI
— Mark Easton (@BBCMarkEaston) March 11, 2020
This strategy failed. It is impossible to 'cocoon' the vulnerable, as Covid is passed from younger people to older, more vulnerable people.
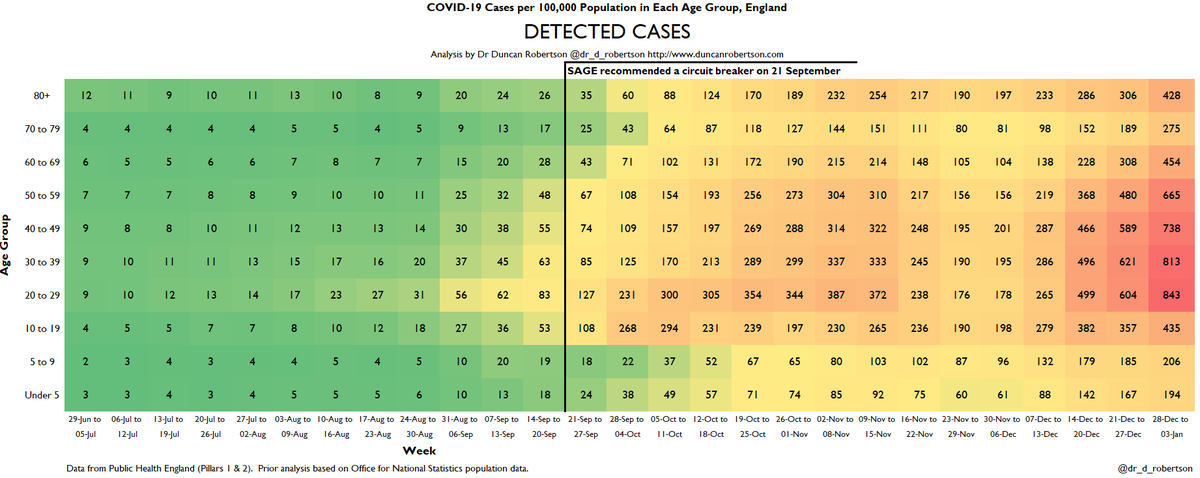
We can see this playing out through heatmaps. e.g. these heatmaps from the second
Here are the heatmaps for Covid detected cases, positivity, hospitalizations, and ICU admissions. This is for the week to 3 January 2021.
— Dr Duncan Robertson (@Dr_D_Robertson) January 7, 2021
I have marked a line on 21 September, when SAGE recommended a circuit breaker, so you can see how the situation has deteriorated since then. pic.twitter.com/SEEVgUVK4j
The Government then decided to change its strategy to 'preventing a second wave that overwhelms the NHS'. This was announced on 8 June in Parliament.
This is not the same as 'preventing a second wave'.
https://t.co/DPWiJbCKRm
The Academy of Medical Scientists published a report on 14 July 'Preparing for a Challenging Winter' commissioned by the Chief Scientific Adviser that set out what needed to be done in order to prevent a catastrophe over the winter
One thing civil servants learn is to write things down. Here is @acadmedsci's 14 July report commissioned by @uksciencechief. For the record.
— Dr Duncan Robertson (@Dr_D_Robertson) September 17, 2020


Which metric is a better predictor of the severity of the fall surge in US states?
1) Margin of Democrat victory in Nov 2020 election
or
2) % infected through Sep 1, 2020
Can you guess which plot is which?
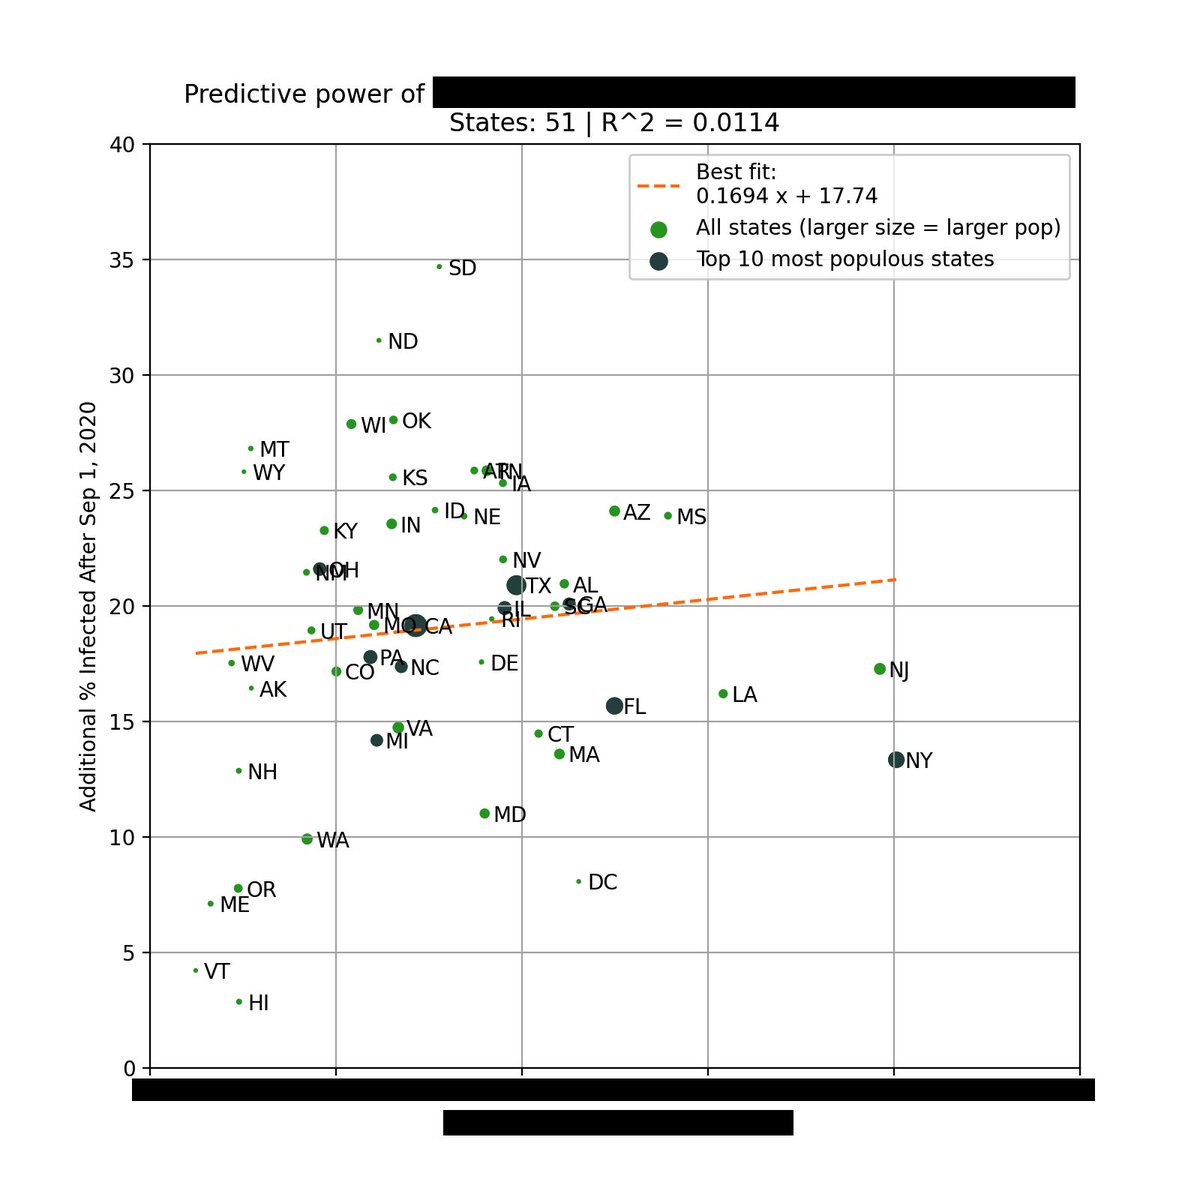
The left plot is based on the % infected through Sep 1, 2020. You can see that there is very little correlation with the % infected since Sep 1.
However, there is a *strong* correlation when using the margin of Biden's victory (right).
Infections % from https://t.co/WcXlfxv3Ah.

This is the strongest single variable I've seen in being able to explain the severity of this most recent wave in each state.
Not past infections / existing immunity, population density, racial makeup, latitude / weather / humidity, etc.
But political lean.
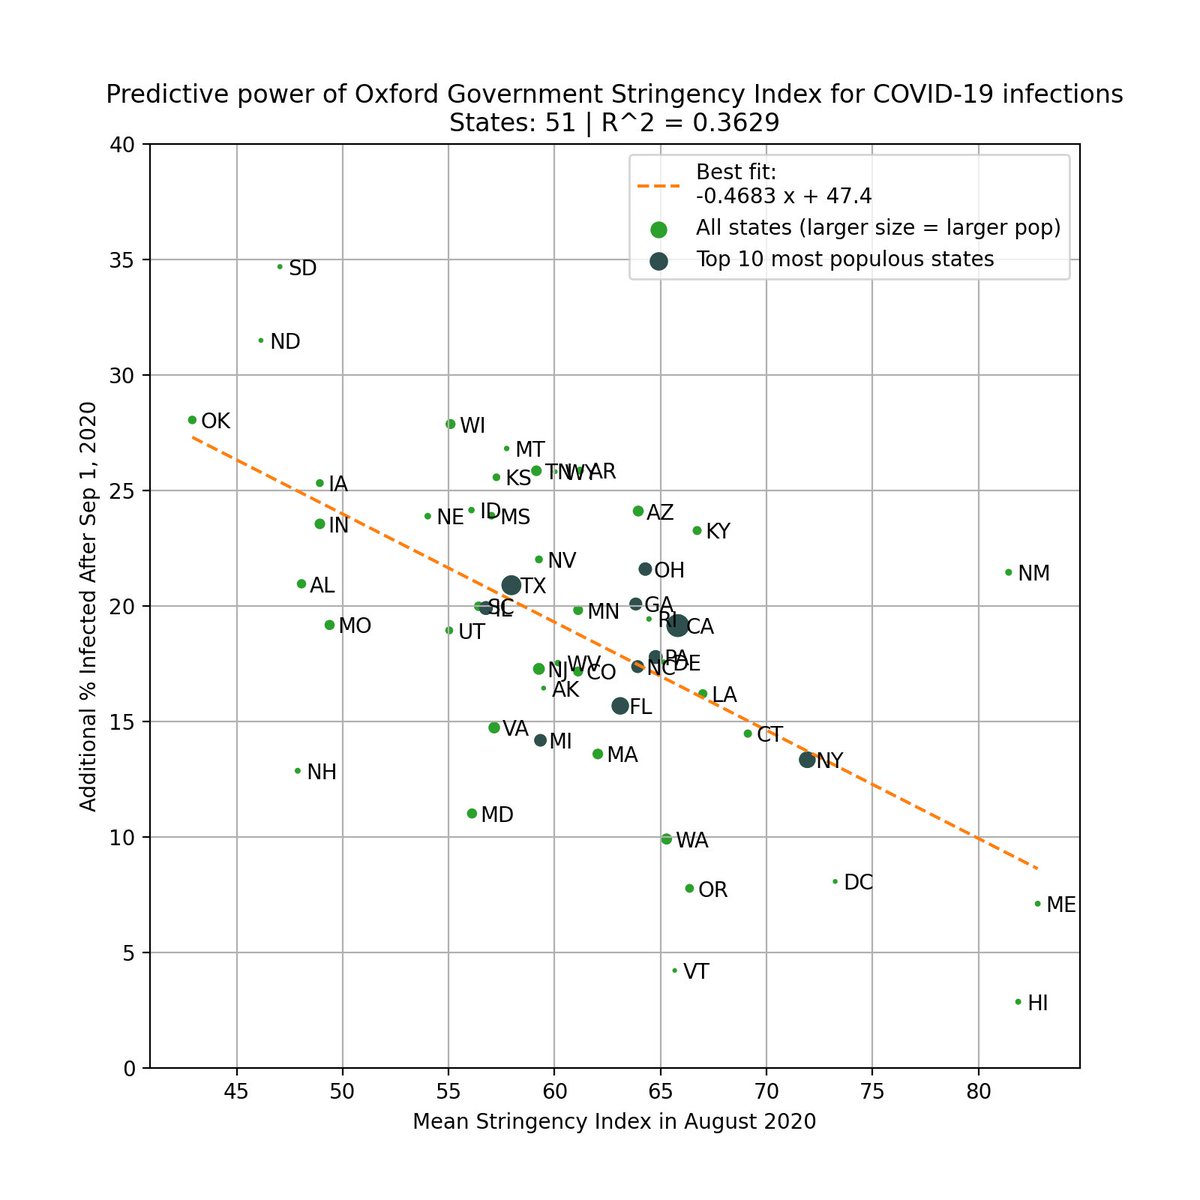
One can argue that states that lean Democrat are more likely to implement restrictions/mandates.
This is valid, so we test this by using the Government Stringency Index made by @UniofOxford.
We also see a correlation, but it's weaker (R^2=0.36 vs 0.50).
https://t.co/BxBBKwW6ta
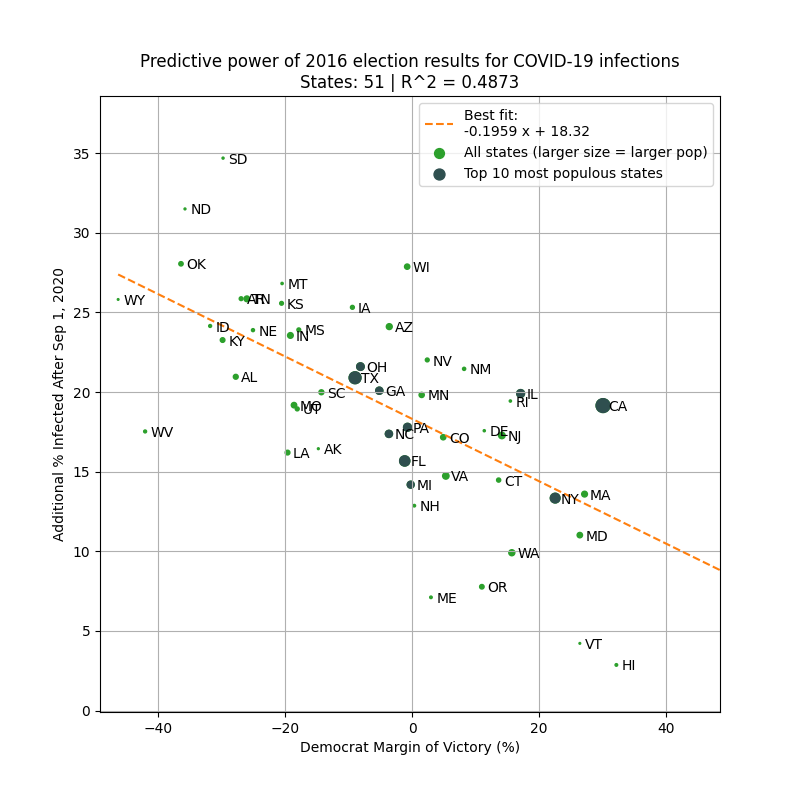
To avoid look-ahead bias/confounding variables, here is the same analysis but using 2016 margin of victory as the predictor. Similar results.
This basically says that 2016 election results is a better predictor of the severity of the fall wave than intervention levels in 2020!
1) Margin of Democrat victory in Nov 2020 election
or
2) % infected through Sep 1, 2020
Can you guess which plot is which?
The left plot is based on the % infected through Sep 1, 2020. You can see that there is very little correlation with the % infected since Sep 1.
However, there is a *strong* correlation when using the margin of Biden's victory (right).
Infections % from https://t.co/WcXlfxv3Ah.
This is the strongest single variable I've seen in being able to explain the severity of this most recent wave in each state.
Not past infections / existing immunity, population density, racial makeup, latitude / weather / humidity, etc.
But political lean.
One can argue that states that lean Democrat are more likely to implement restrictions/mandates.
This is valid, so we test this by using the Government Stringency Index made by @UniofOxford.
We also see a correlation, but it's weaker (R^2=0.36 vs 0.50).
https://t.co/BxBBKwW6ta
To avoid look-ahead bias/confounding variables, here is the same analysis but using 2016 margin of victory as the predictor. Similar results.
This basically says that 2016 election results is a better predictor of the severity of the fall wave than intervention levels in 2020!


