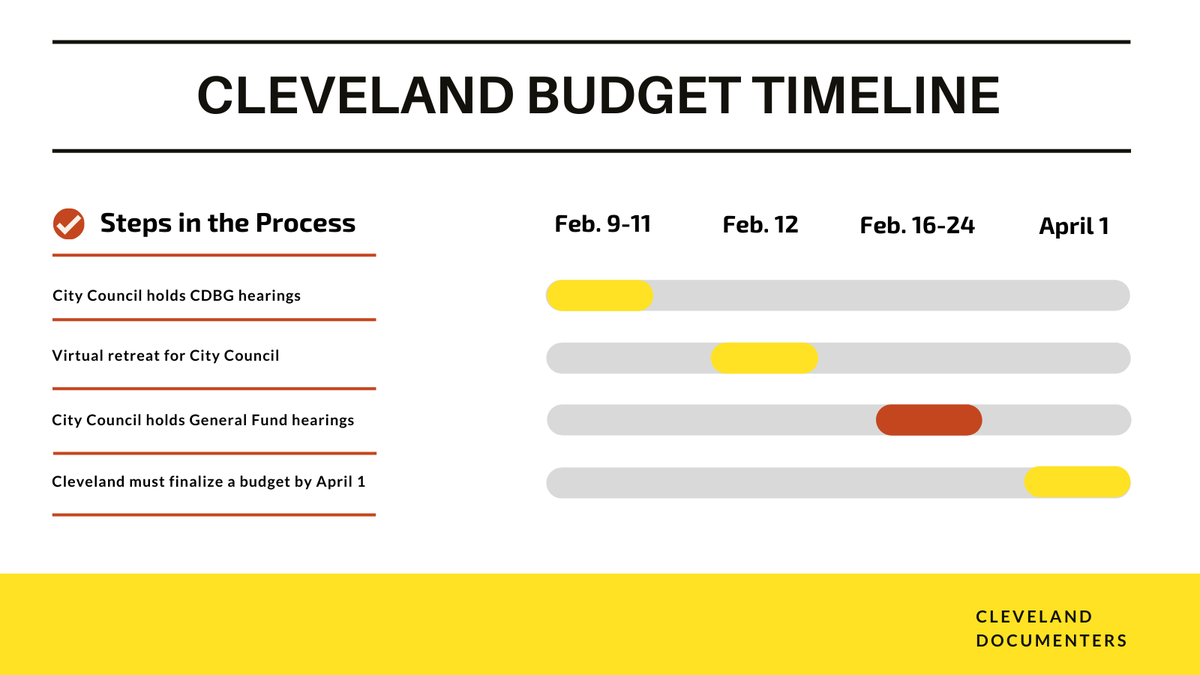
First, it helps to know where we are in the budget process. From today through Feb. 24, the council will meet about the General Fund budget. The council will then agree on a budget with their changes (if any); 15 days after doing so, they can vote to make the budget official.
In other words, there’s still time to use your voice! The #refundcleveland tool can help. Create the #CLEBudget you want and send it to your council member. Click “Change the Budget” on the homepage and follow the on-screen instructions from there.
https://t.co/ljyAhABg5h
Want to know the budget basics? Our #CLEBudget primer details the timeline, different types of budgets and the funds involved, and defines budget-related terms. It can be a helpful guide during City Council’s discussions.
https://t.co/Uz3yjYAmAP
And don’t forget: all these meetings are livestreamed on City Council’s YouTube channel. They’re slated to start at 9 a.m. every business day from today through the 24th. You can also follow along with #CLEDocumenters live-tweet threads and notes.https://t.co/pLwmzS0f1S
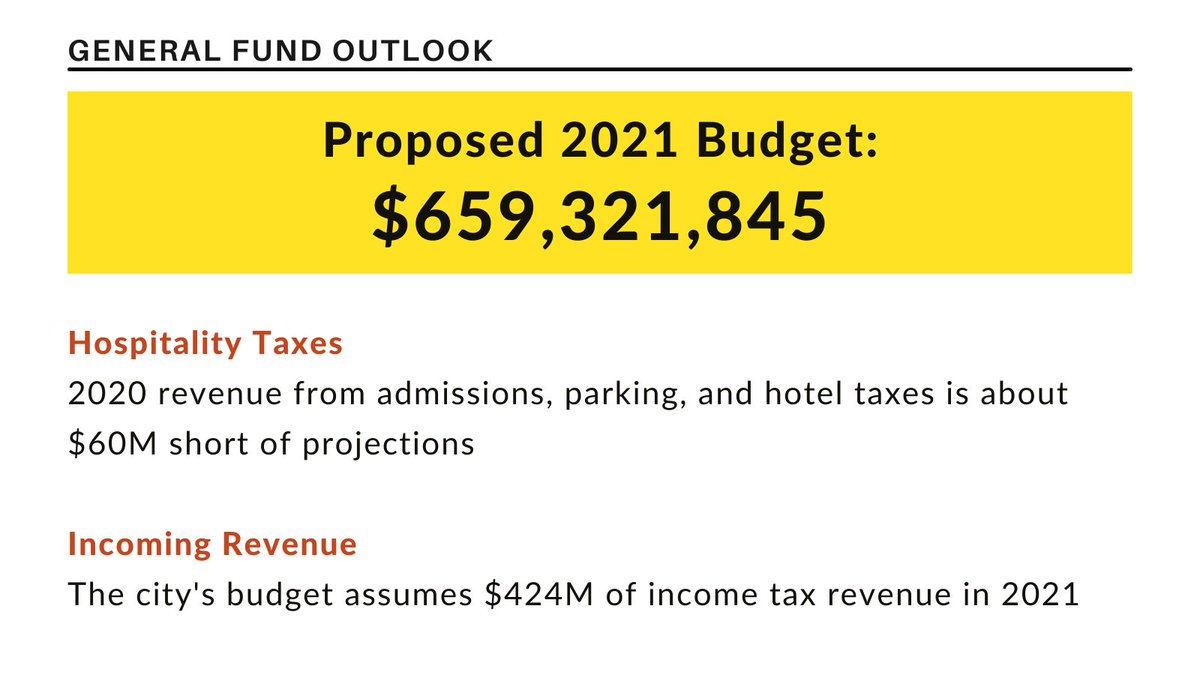
Now, let’s dig into some details. The General Fund supports most city services, including police, fire, emergency medical services, rec centers, and trash collection. It’s funded by state and local taxes, service charges, licenses and permits, and fines. Here’s what we learned.
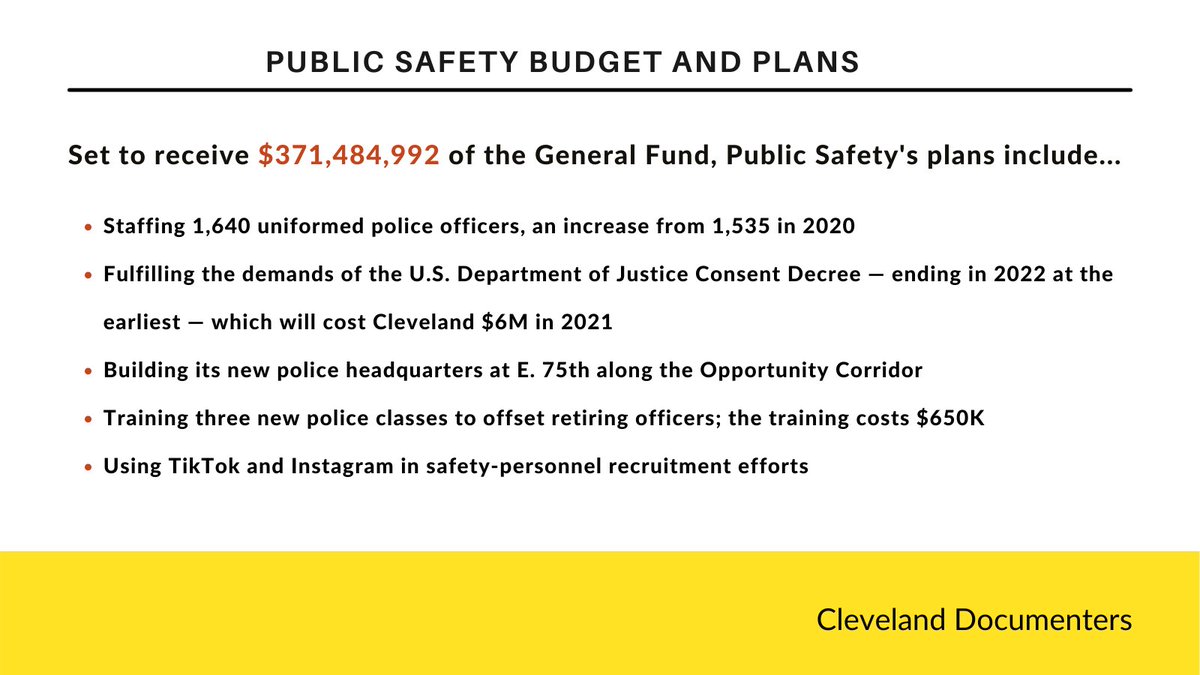
We also learned a bit about the Department of Public Safety, which is set to receive the biggest portion of the General Fund budget — about 56% of it. Here are some key department tidbits that Documenters captured.
City Council also asked for clarification regarding how many officers $1M can afford. The city says $1M can cover 6-7 police officers; some council members said they’d previously been told $1M could fund 10 officers.
Curious about City Council’s approach heading into the General Fund hearings? Read through this live-tweet thread of last Friday’s virtual retreat by
@GenniferwithaG_ https://t.co/qCjwAJo18Y
You can also take in Mary Paxton’s notes on the afternoon portion of the retreat.
https://t.co/uFFxeboLiS
And you can work through the mayor’s full proposed General Fund budget here:
https://t.co/U3EGaIwDLy
Despite some newsworthy nuggets regarding the General Fund, the council spent much of last week discussing Community Development Block Grants, also known as CDBG funding. What is CDBG? Well...
Essentially, CDBG is money provided by the U.S. Department of Housing and Urban Development (HUD). HUD intends for CDBG funds to be used for safe, decent housing and economic opportunity in low-wealth areas. Check out our #CLEBudget primer for more CDBG insight.
Also, this thread from
@Jesstrivisonno, economic development director for the Detroit-Shoreway and Cudell Inc. community development corporations (CDCs), provides a detailed look at the challenges surrounding CDBG funds and the way Cleveland uses them.
https://t.co/S8Lv1dYgEs
Here are some high-level takeaways from last week’s CDBG hearings. #CLEBudget
Have the CDBG heebie-jeebies? Learn more from the following live-tweet threads from #CLEDocumenters who observed last week’s hearings…
@seandene on the Feb. 9 afternoon session:
https://t.co/7z0uzaj3gt
Leslie Bednar’s notes on day three of the CDBG hearings offer important details, as well.
https://t.co/NLE1znVcST
And you can read the proposed CDBG budget book here.
https://t.co/mppuEKZx8Z
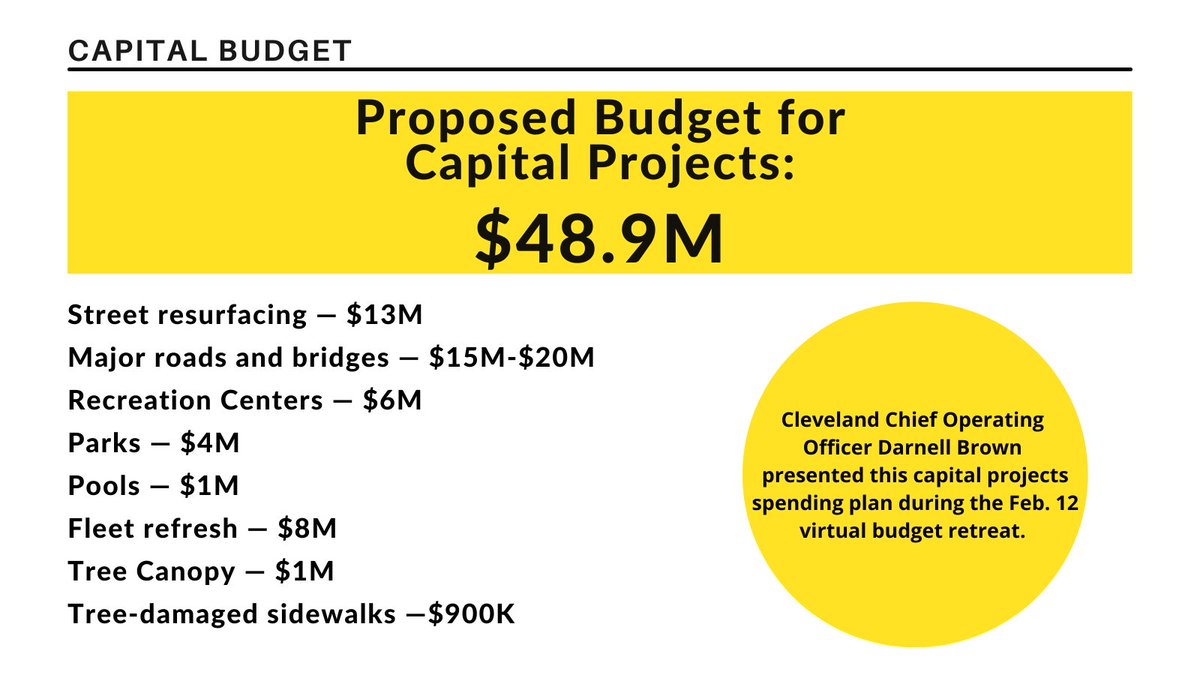
Think the learning stopped there? Not so. Documenters also gleaned some info about the Capital Budget, which is reserved for larger, long-term investments in city infrastructure. City Council and the City of Cleveland finalize this budget a little later in the year.
In fact, as of last Friday’s virtual retreat, the full Capital Budget book was not complete. Regardless, Documenters did gather some important details.
Learn more about the Capital Budget and the General Fund from Leslie Bednar’s notes on the morning portion of Friday’s virtual retreat.
https://t.co/YpUckQZlnx
And here is the full capital projects presentation that the city gave to council members during Friday’s retreat.
https://t.co/6yoboefP02
Keep up with all Documenters reporting on our website. Documenters will cover the remaining budget meetings, along with other city government happenings.
https://t.co/rWTPAI2ytm
That’s a wrap on this thread, which is just a snapshot of what last week’s #CLEBudget meetings entailed. Let us know if you have any questions, and stay tuned for more documenting!