Fast forward to today when I added Gold at 1850. It made a sharp-up move but didn't want to sell for the sake of hedging. The positions were scaled up around 1925 with the fresh SL of 1900.
So far doing good. 2000 is the level I would be looking for. https://t.co/j1kiKRSx0y
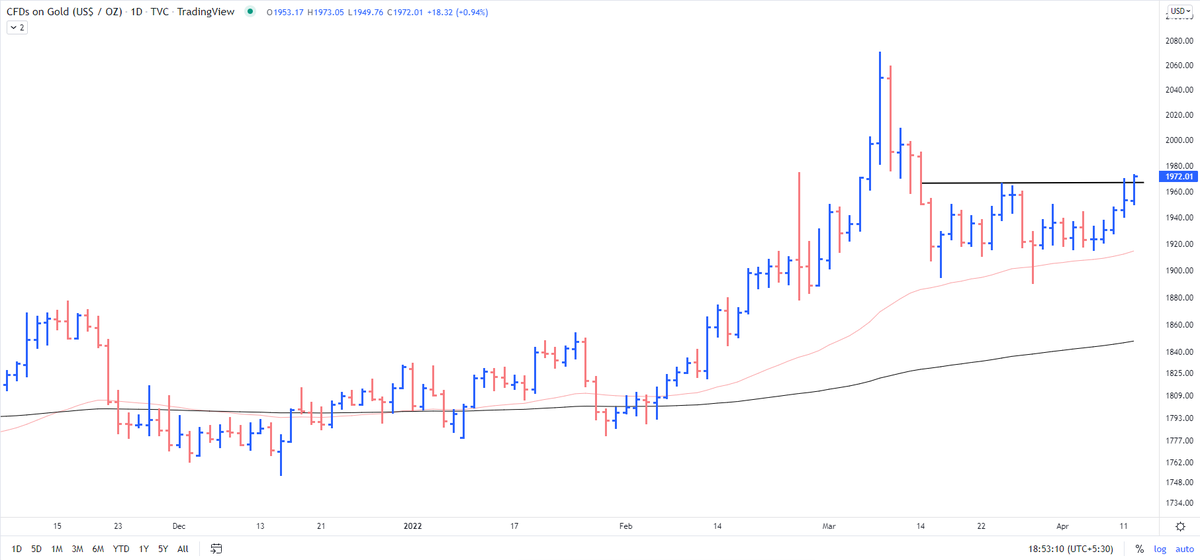
GOLD - 1 9 2 7 from 1 8 5 0
— The_Chartist \U0001f4c8 (@charts_zone) February 24, 2022
No indicators, nothing. Understand the language of the price. https://t.co/l6pEGD7r6D pic.twitter.com/JWZjlTLSBF
More from The_Chartist 📈
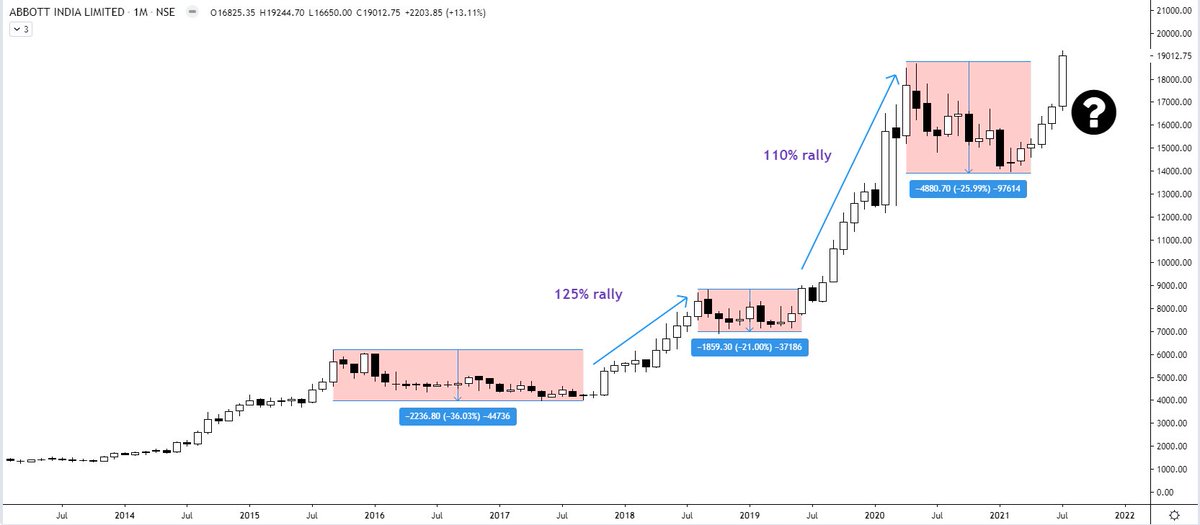

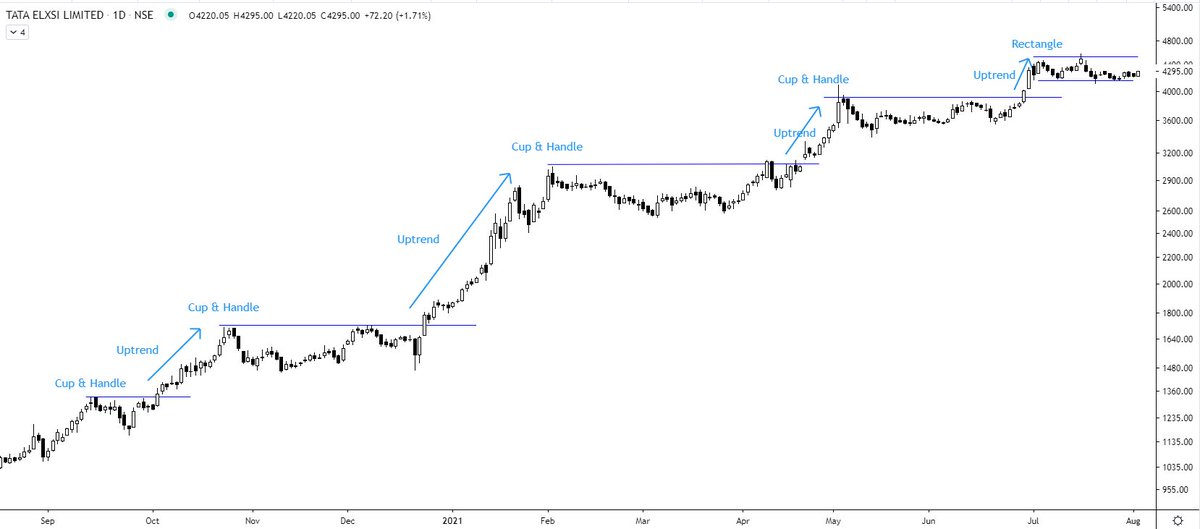
Tata Elxsi (W) - near to the resistance zone again 5th time. @nishkumar1977 @suru27 @rohanshah619 @indian_stockss @sanstocktrader @BissaGauravB @RajarshitaS @PAVLeader @Rishikesh_ADX @VijayThk @Investor_Mohit @TrendTrader85 @jitendra_stock pic.twitter.com/aIC5kO8XqA
— Steve Nison (@nison_steve) December 18, 2020
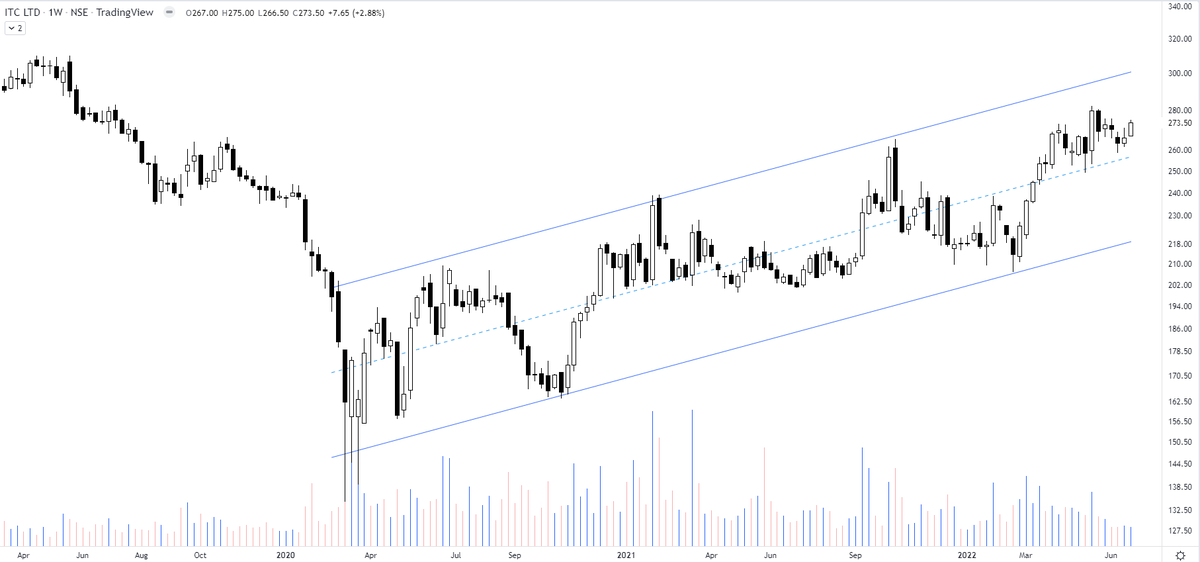
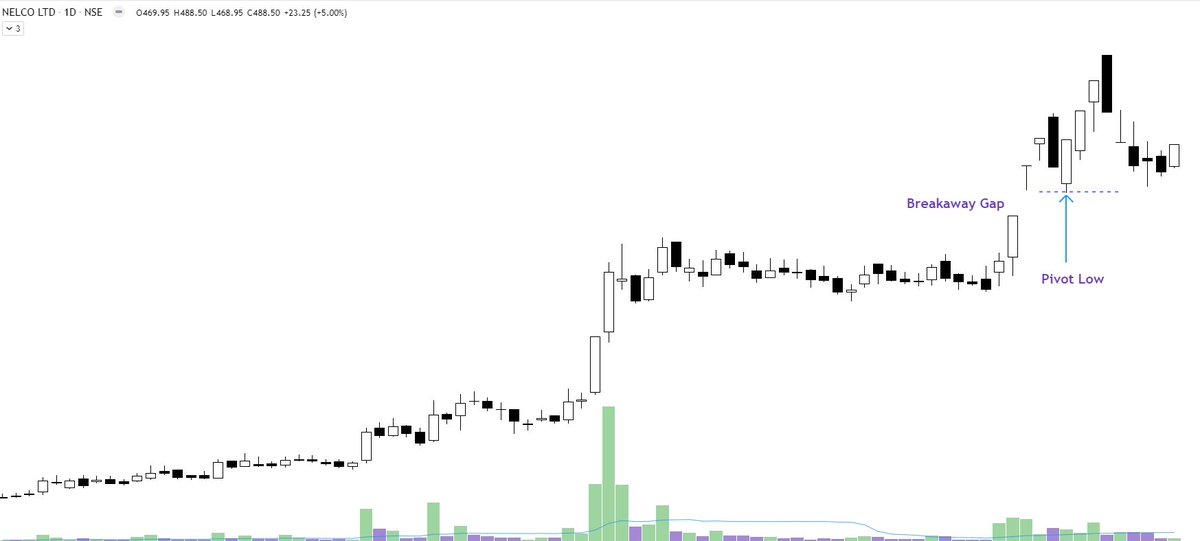
ITC - how beautifully the price patterns work. All of a sudden an increased momentum right from the support of the channel boundary. Has a minor resistance to nail down in the middle.
— The_Chartist \U0001f4c8 (@charts_zone) March 18, 2022
Anyone observing it would have gone aggressive at lower end for a swing move pic.twitter.com/YqxkdFlJXQ
More from Gold

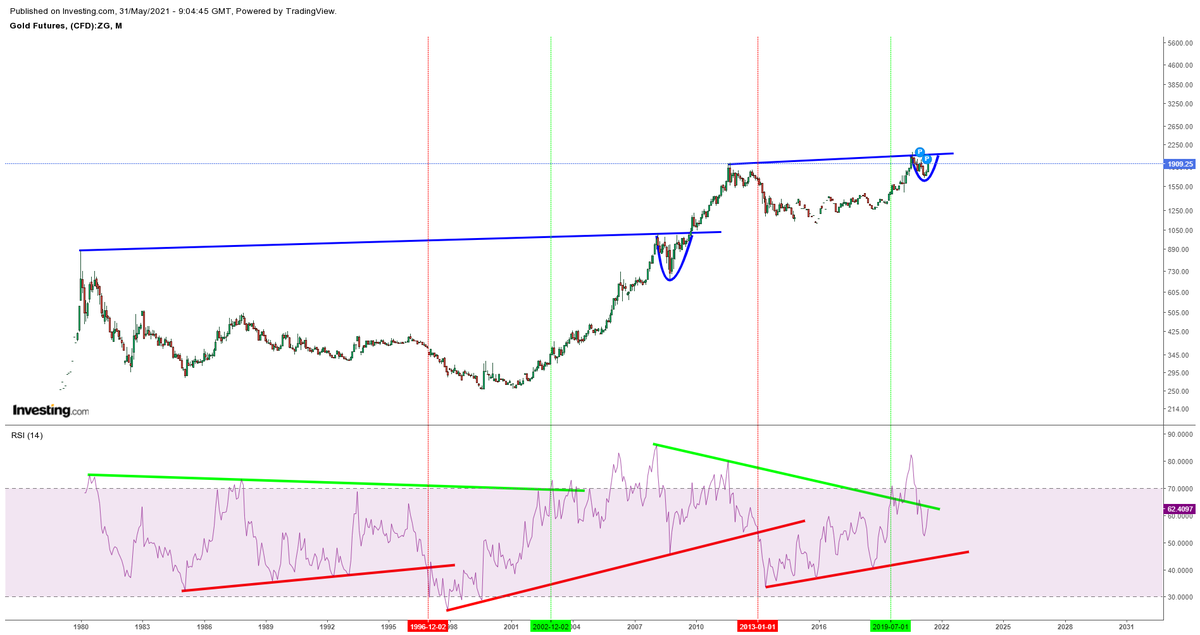



This might be the best gold analog chart i have ever seen. When you overlap the yellow 1970-1980 inflationary gold bull market over the green 1999-2021 #gold bull the correlation is unbelievable. Chart from Mike Maloney. Protect your fiat holdings from oncoming inflation. $GLD pic.twitter.com/R9Hyl9Nwe3
— Edward Gofsky (@EdwardGofsky) May 10, 2021