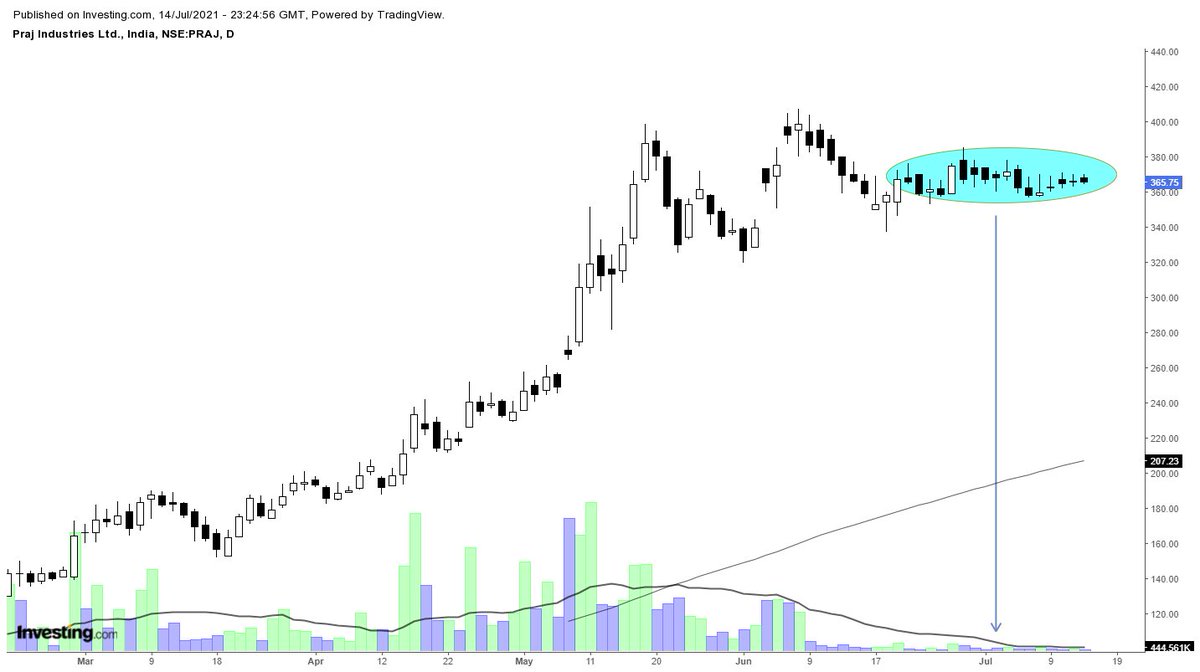
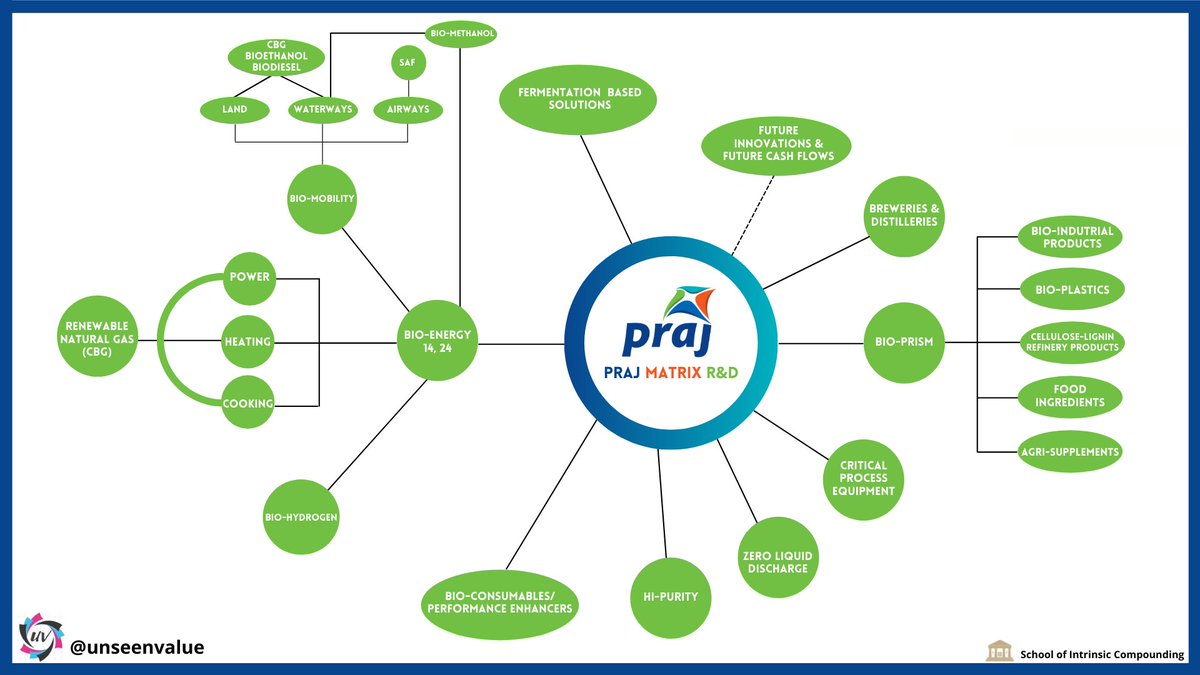
Praj Industries - keep on the radar. Price is telling something. Smart money most probably pushing out. Strict SL needed. Volatility contracted.
More from Steve Nison
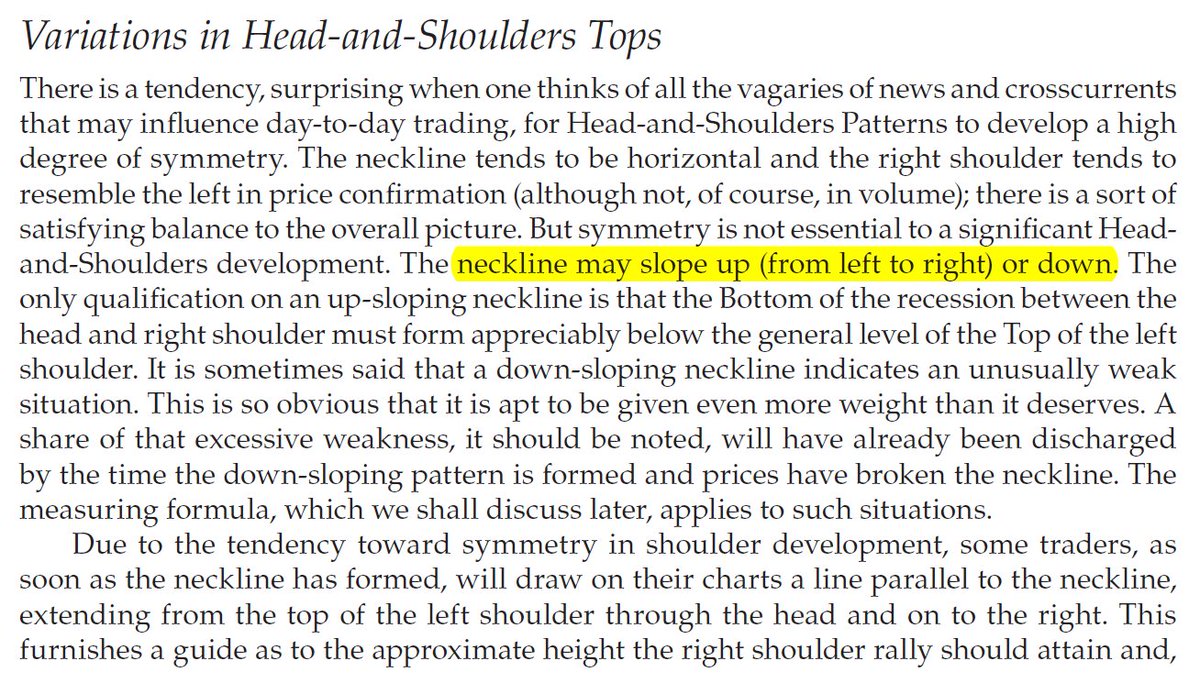
Sir Edwards & Magee discussed sloping necklines in H&S in their classical work. I am considering this breakdown by Affle as an H&S top breakdown with a target open of 770.
— The_Chartist \U0001f4c8 (@charts_zone) May 25, 2022
The target also coincides with support at the exact same level. pic.twitter.com/n84kSgkg4q
This exercise will tell you about your inherent strengths & weaknesses. 👇👇
How to record a trading journal (TJ) & what to analyze?
— The_Chartist \U0001f4c8 (@charts_zone) December 14, 2021
What is in a TJ?
Buy Date
Stock Name
The time frame you analyzed (D/W/M)
Long/Short?
Buy Price
SL
Sell Price
Risk took (% of capital)
Sell date
No. of days held
P/L
P/L as % of capital
Buy Reason?
Invested capital/trade pic.twitter.com/WnrvmYuOV0
More from Praj


Some interesting pointers to understand few misunderstood stuff revolving around Ethanol and all the verticals Praj Industries is into. All of these were answered by Mr. Shishir Joshipura of Praj Industries.
— swapnilkabra (@caswapnilkabra) August 26, 2021
Do retweet for maximum reach. \U0001f447\U0001f9f5


Talking Point | Praj Industries' revenue & net profit contract in Q1 but earnings are better than expectations.
— BloombergQuint (@BloombergQuint) August 13, 2021
MD & CEO Shishir Joshipura talks about the quarter gone by and growth acceleration led by the government's ethanol push. @_nirajshah #BQLive https://t.co/DzSARyZ2Ti

You May Also Like





This New York Times feature shows China with a Gini Index of less than 30, which would make it more equal than Canada, France, or the Netherlands. https://t.co/g3Sv6DZTDE
That's weird. Income inequality in China is legendary.
Let's check this number.
2/The New York Times cites the World Bank's recent report, "Fair Progress? Economic Mobility across Generations Around the World".
The report is available here:
3/The World Bank report has a graph in which it appears to show the same value for China's Gini - under 0.3.
The graph cites the World Development Indicators as its source for the income inequality data.

4/The World Development Indicators are available at the World Bank's website.
Here's the Gini index: https://t.co/MvylQzpX6A
It looks as if the latest estimate for China's Gini is 42.2.
That estimate is from 2012.
5/A Gini of 42.2 would put China in the same neighborhood as the U.S., whose Gini was estimated at 41 in 2013.
I can't find the <30 number anywhere. The only other estimate in the tables for China is from 2008, when it was estimated at 42.8.