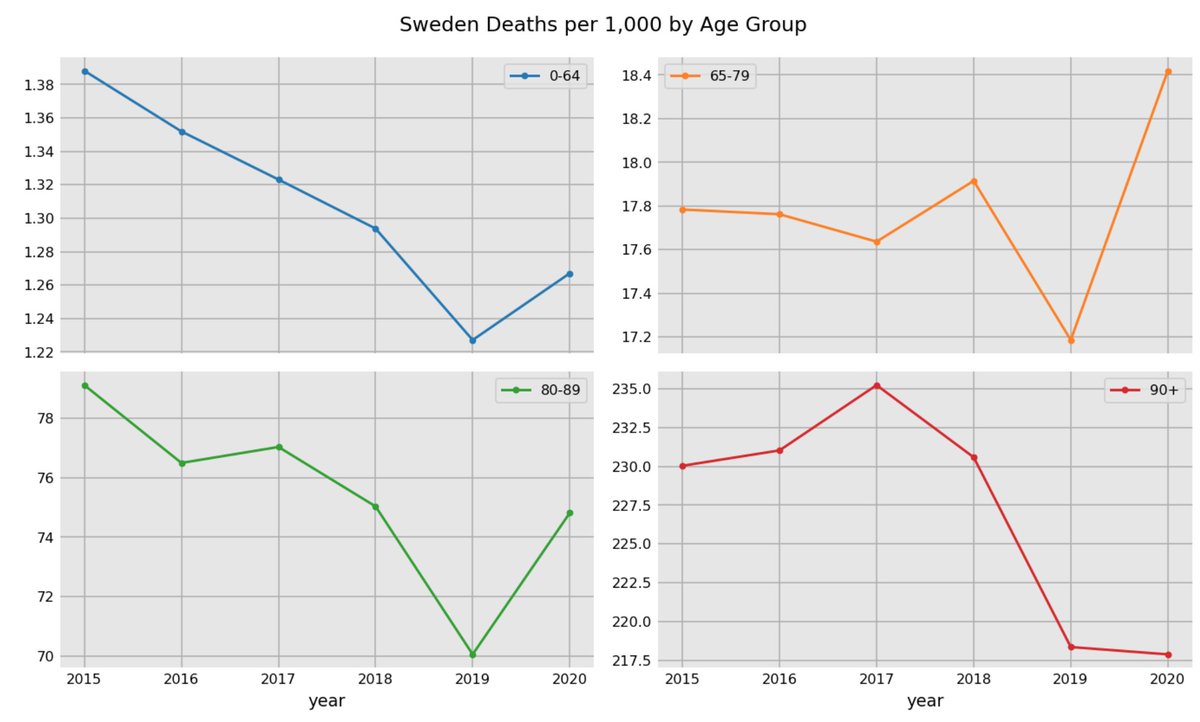
Overall death numbers are meaningless without stratifying by age. Below, we have mortality rates from 2015-2020 by age groups 0-64, 65-79, 80-89, and 90+. The 65-79 group fared worst with ~3% inc. over 2015-18 average.
Amazingly, the 90+ group had lower mortality in 2020.
All age groups can be plotted on the same graph, but must be standardized since the range of values is so large (1 for 0-64 vs 200 for 90+)
Here, mortality rates are shown relative to 2018.
The most interesting observation (imo) is the significant drop in mortality rate in 2019 in all age groups.
Around 60% of all deaths in Sweden come from the 80+ age group. When mortality rates dropped 5% in 2019, this left a much larger than normal 80+ pop alive in 2020.
This lead to a swelling of the 80+ population in 2020 by 6.6%. This was by far the biggest percentage increase in one age group over the 5 year period of data
Pop. Deaths
2018 - 522k 54k
2019 - 536k 52k
2020 - 572k 59k
Looking at the extremes, the 100+ population increased by nearly 50%, from 2200 to 3100. The probability of death for a random 100 year old is 35%. So, this very small subset of the population (.03%) will be responsible for ~1.2% of all deaths in Sweden.
With this huge increase in 80+ population and a slight decline in the 0-64 population, Sweden was primed for a large increase in total deaths in 2020.
Total Deaths
2018 - 92185
2019 - 88766
2020 - 97811 (slight downward adjustment for leap year)
In conclusion, Sweden's total deaths increased by 10%, but their mortality rate by age was very similar to the 2015-2018 average. A substantial drop in mortality rates in 2019, left a much larger elderly population alive in 2020.
All data sources are from Sweden's official statistics page -
https://t.co/mcvpPWfcdK I used the June 2020 population estimate by age group for the analysis.
I've issued a correction to this. 2020 population numbers were slightly inflated, bringing mortality rates down to around the average of 2011-2020 and not lower than 2015-2018 average.
https://t.co/veHH4luKkF