
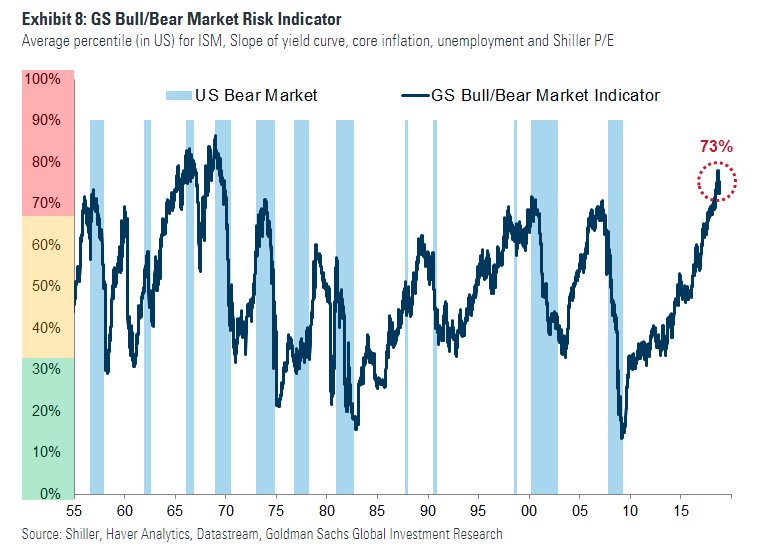
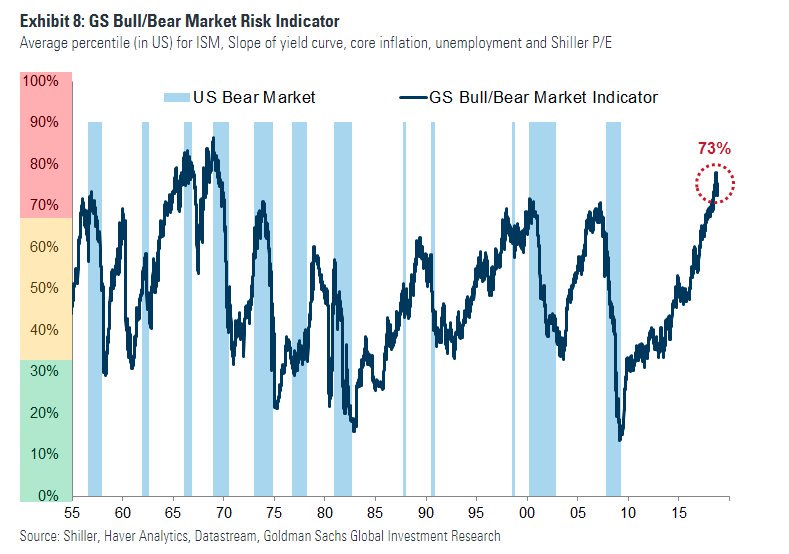
A thread on an interesting report by Goldman Sachs' Peter Oppenheimer, the bank's chief global equity strategist. He points out that Goldman's "Bear Market Risk Indicator" is looking ominous.

More from Economy


On Jan 6, 2021, the always stellar Mr @deepakshenoy tweeted, this:
https://t.co/fa3GX9VnW0
Innocuous 1 sentence, but its a full economic theory at play.
Let me break it down for you. (1/n)
On September 30, 2020, I wrote an article for @CFASocietyIndia where I explained that RBI is all set to lose its ability to set interest rates if it continues to fiddle with the exchange rate (2/n)
What do I mean, "fiddle with the exchange rate"?
In essence, if RBI opts and continues to manage exchange rate, then that is "fiddling with the exchange rate"
RBI has done that in the past and has restarted it in 2020 - very explicitly. (3/n)
First in March 2020, it opened a Dollar/INR swap of $2B with far leg to be unwound in September 2020.
Implying INR will be bought from the open markets in order to prevent INR from falling vis a vis USD (4/n)
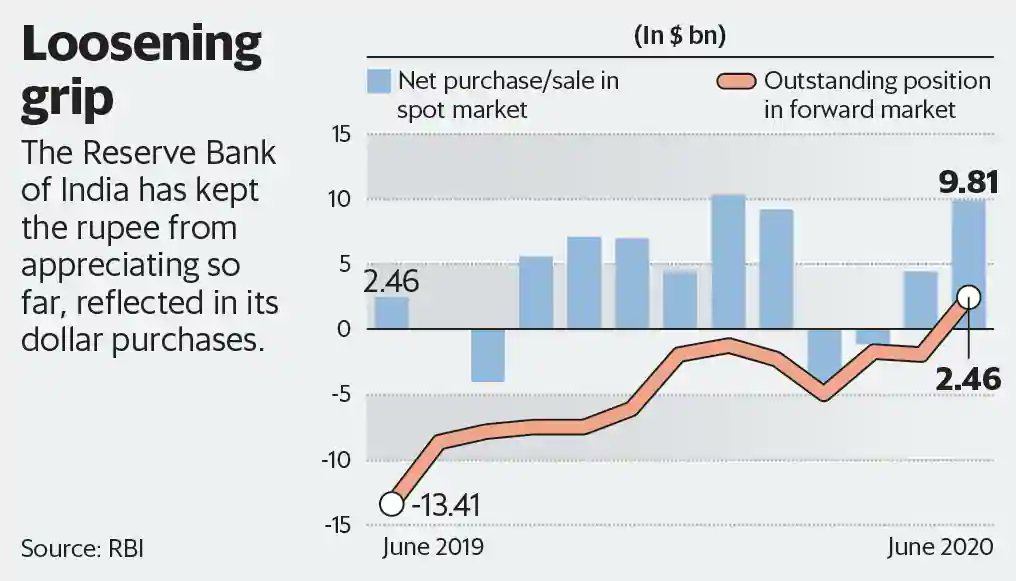
The Second aspect is now, that dollar inflow is happening, and the forex reserves swelled -> implying the rupee is appreciating, RBI again intervened from September, by selling INR in spot markets. (5/n)
https://t.co/9kpWP7ovyM
https://t.co/fa3GX9VnW0
Innocuous 1 sentence, but its a full economic theory at play.
Let me break it down for you. (1/n)
91 day TBills at 3.03%. Interest rates are even lower than RBI has them.
— Deepak Shenoy (@deepakshenoy) January 6, 2021
On September 30, 2020, I wrote an article for @CFASocietyIndia where I explained that RBI is all set to lose its ability to set interest rates if it continues to fiddle with the exchange rate (2/n)
What do I mean, "fiddle with the exchange rate"?
In essence, if RBI opts and continues to manage exchange rate, then that is "fiddling with the exchange rate"
RBI has done that in the past and has restarted it in 2020 - very explicitly. (3/n)
First in March 2020, it opened a Dollar/INR swap of $2B with far leg to be unwound in September 2020.
Implying INR will be bought from the open markets in order to prevent INR from falling vis a vis USD (4/n)
The Second aspect is now, that dollar inflow is happening, and the forex reserves swelled -> implying the rupee is appreciating, RBI again intervened from September, by selling INR in spot markets. (5/n)
https://t.co/9kpWP7ovyM


