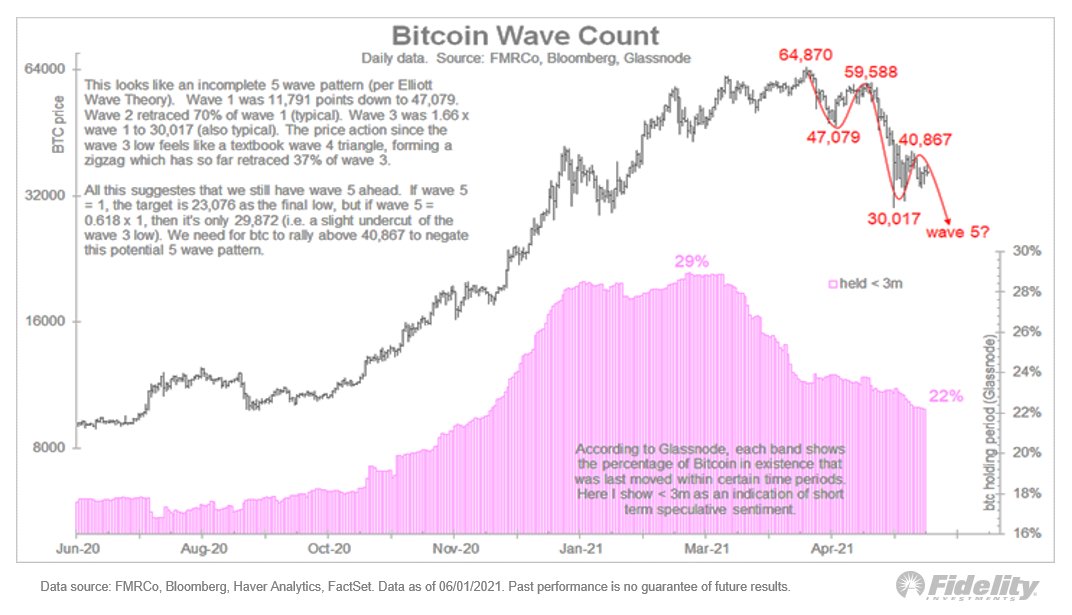
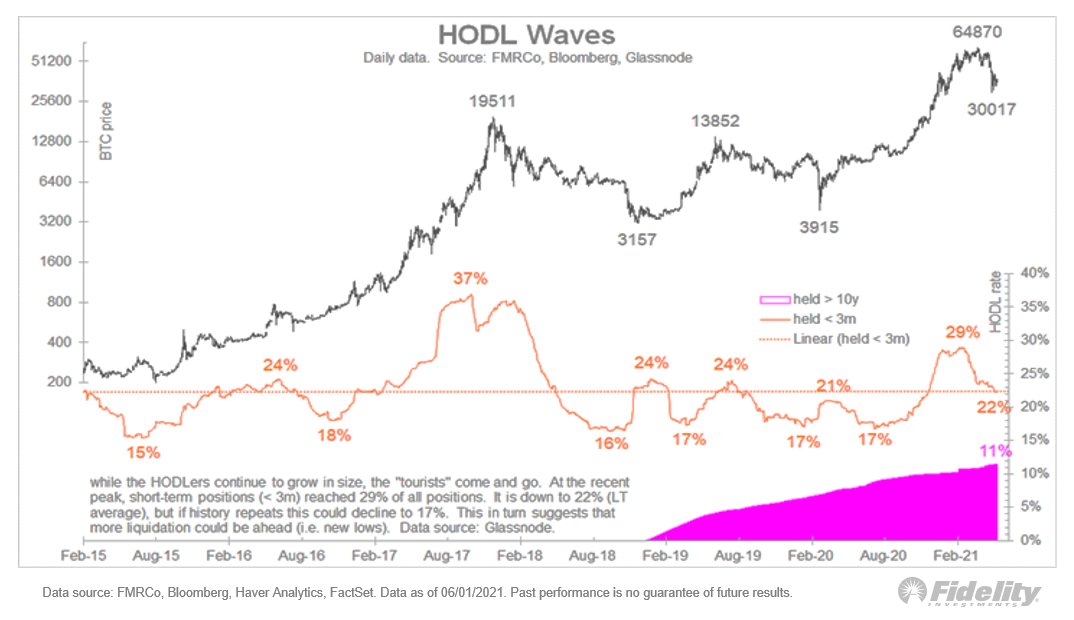
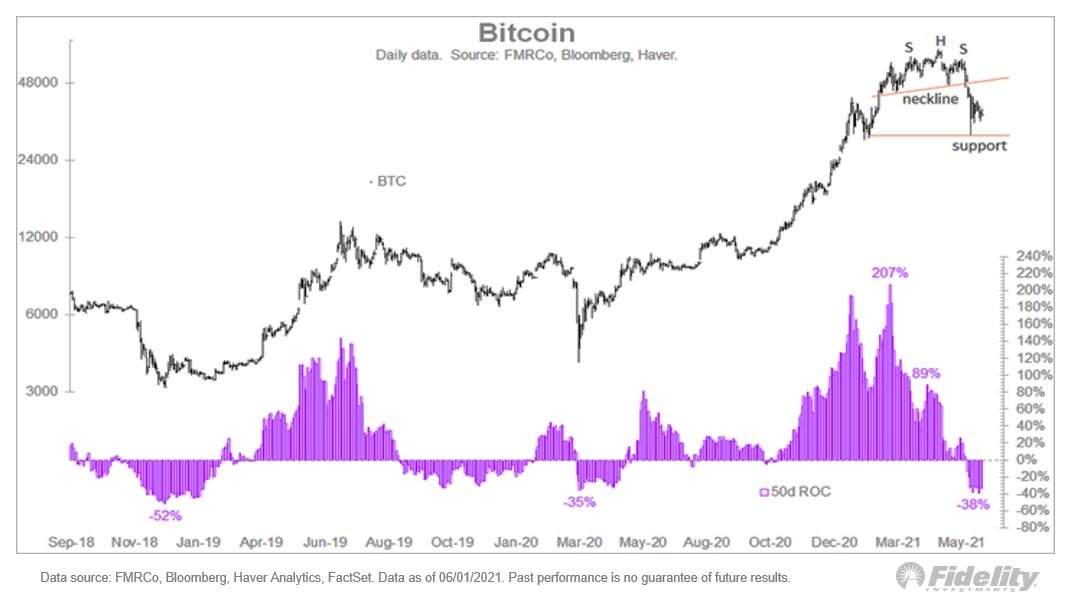
As a “lifelong” technician, I am finding that bitcoin lends itself well to technical analysis. Here is my take on the recent price action. (THREAD)
More from Crypto

1/ @MIT discussing the need for blockchain gateways to achieve interoperability across different blockchain networks, and to support the cross-blockchain mobility of virtual assets
https://t.co/PbjQkSlTT3
@quant_network are collaborating with MIT in the creation of ODAP
$QNT
2/ "In order for blockchain-based services to scale globally, blockchain networks must be able to interoperate with one another following a standardized protocol and interfaces (APIs)"
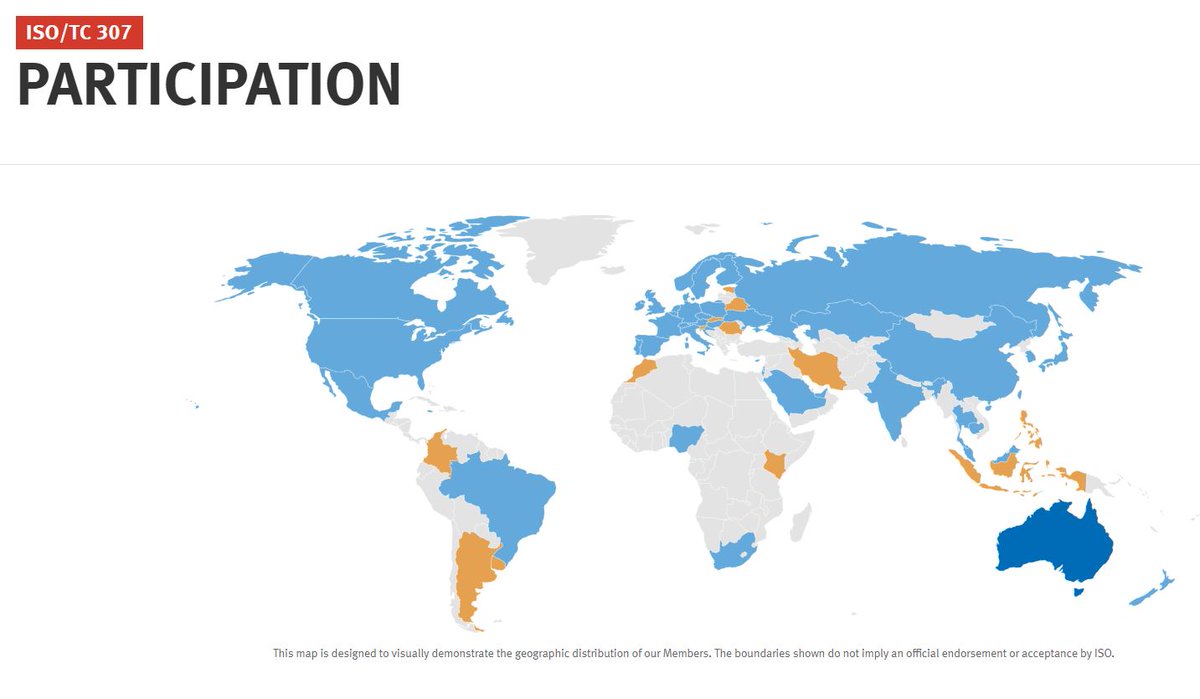
Gilbert founded ISO TC307 which 60 countries are working towards standardizing the interfaces
3/ "We believe that a blockchain gateway is needed for blockchain networks to interoperate in a manner similar
to border gateway routers in IP networks. Just as border gateway routers use the BGPv4 protocol to interact with one another in a peered fashion we believe that a...
4/ blockchain gateway protocol will be needed to permit the movement of virtual assets and related information across blockchain networks in a secure and privacy-preserving manner"
You can read more about the gateway protocol ODAP in this 21 tweet
5/
"We motivate the need for blockchain gateways and blockchain gateway protocols in the following summary:
✅Enables blockchain interoperability:
Blockchain gateways provide an interface for the interoperability between blockchain/DLT systems that operate distinct consensus...
https://t.co/PbjQkSlTT3
@quant_network are collaborating with MIT in the creation of ODAP
$QNT
2/ "In order for blockchain-based services to scale globally, blockchain networks must be able to interoperate with one another following a standardized protocol and interfaces (APIs)"
Gilbert founded ISO TC307 which 60 countries are working towards standardizing the interfaces
3/ "We believe that a blockchain gateway is needed for blockchain networks to interoperate in a manner similar
to border gateway routers in IP networks. Just as border gateway routers use the BGPv4 protocol to interact with one another in a peered fashion we believe that a...
4/ blockchain gateway protocol will be needed to permit the movement of virtual assets and related information across blockchain networks in a secure and privacy-preserving manner"
You can read more about the gateway protocol ODAP in this 21 tweet
See this 21-tweet thread about the creation of an Internet scale protocol to move digital assets involving Quant, MIT, US Government, Intel, Juniper, Payment and Telecom companies \U0001f447https://t.co/n7VGIIlAvq pic.twitter.com/mTUEmCMFZM
— Seq (@CryptoSeq) December 22, 2020
5/
"We motivate the need for blockchain gateways and blockchain gateway protocols in the following summary:
✅Enables blockchain interoperability:
Blockchain gateways provide an interface for the interoperability between blockchain/DLT systems that operate distinct consensus...

1/ Bitcoin: a bold new world.
Satoshi published the white paper on 10/31/2008. Right at the moment of peak despair during the 2008 financial crisis. Trust had been lost in a world that ran on trust.
2/ But why October 31st? It certainly wasn’t because Satoshi was a fan of halloween, it must have had a deeper meaning. With all of his actions, he demonstrated a careful precision.
He had been working on Bitcoin for at least a year and a half before publishing the white paper.
3/ “I believe I've worked through all those little details over the last year and a half while coding it, and there were a lot of them. The functional details are not covered in the paper, but the sourcecode is coming soon” - Satoshi Nakamoto
4/ On August 18, 2008 Satoshi registers registers https://t.co/rMWwiEwtxT through https://t.co/Uj8lMr10kB.
Satoshi was ready and waiting to hit the send button throughout 2008. What was so special about October 31st?
5/ I believe that Satoshi published the Bitcoin white paper on 10/31 as a hat tip to the ancient Gaelic festival of “Samhain” which was also the date in which Martin Luther nailed his 95 Theses to a church door. Both represent an end of the old and the beginning of the new.

0/ The Great Crypto Reversal
Key difference between the '17 and roaring 20s in crypto is that back then everyone was aping a16z and Naval.
Today everyone apes 3AC wanting to be the next Degen.
'17 was an idealistic *saving the world* kind of thing
20s is *me against the world*
1/ The financialization of crypto means more volatility but pretty long ascend to the top.
Multi-year bull and an ATH surprising even to the biggest bulls as the infinite Cantillon "wealth" is pumped into crypto
Crypto becomes the ultimate Cantillon insider circle-jerk.
2/ This will be one the most iconic ideological reversals in history, comparable to Google who was firmly against advertising but turned into the most powerful ad company ever.
3/ This scenario reminds me of the 90s privatization period in the post-socialist countries.
The regime transition allowed the communist party elite to benefit from the wild west form of "capitalism" that ensued, transferring (and multiplying) their wealth into the new regime.
4/ We are far from Satoshi's original vision . But words and intentions of *prophets* were used to manipulate and corrupt all throughout human history and this time it is no
At "forever" Cantillon insiders are infinitely wealthy. Everybody else lives in pods & eats what the livestock eats, or joins the harem or household staff of an infinitaire.
— Nick Szabo (@NickSzabo4) January 21, 2020

You May Also Like


Trading view scanner process -
1 - open trading view in your browser and select stock scanner in left corner down side .
2 - touch the percentage% gain change ( and u can see higest gainer of today)
3. Then, start with 6% gainer to 20% gainer and look charts of everyone in daily Timeframe . (For fno selection u can choose 1% to 4% )
4. Then manually select the stocks which are going to give all time high BO or 52 high BO or already given.
5. U can also select those stocks which are going to give range breakout or already given range BO
6 . If in 15 min chart📊 any stock sustaing near BO zone or after BO then select it on your watchlist
7 . Now next day if any stock show momentum u can take trade in it with RM
This looks very easy & simple but,
U will amazed to see it's result if you follow proper risk management.
I did 4x my capital by trading in only momentum stocks.
I will keep sharing such learning thread 🧵 for you 🙏💞🙏
Keep learning / keep sharing 🙏
@AdityaTodmal
1 - open trading view in your browser and select stock scanner in left corner down side .
2 - touch the percentage% gain change ( and u can see higest gainer of today)
Making thread \U0001f9f5 on trading view scanner by which you can select intraday and btst stocks .
— Vikrant (@Trading0secrets) October 22, 2021
In just few hours (Without any watchlist)
Some manual efforts u have to put on it.
Soon going to share the process with u whenever it will be ready .
"How's the josh?"guys \U0001f57a\U0001f3b7\U0001f483
3. Then, start with 6% gainer to 20% gainer and look charts of everyone in daily Timeframe . (For fno selection u can choose 1% to 4% )
4. Then manually select the stocks which are going to give all time high BO or 52 high BO or already given.
5. U can also select those stocks which are going to give range breakout or already given range BO
6 . If in 15 min chart📊 any stock sustaing near BO zone or after BO then select it on your watchlist
7 . Now next day if any stock show momentum u can take trade in it with RM
This looks very easy & simple but,
U will amazed to see it's result if you follow proper risk management.
I did 4x my capital by trading in only momentum stocks.
I will keep sharing such learning thread 🧵 for you 🙏💞🙏
Keep learning / keep sharing 🙏
@AdityaTodmal