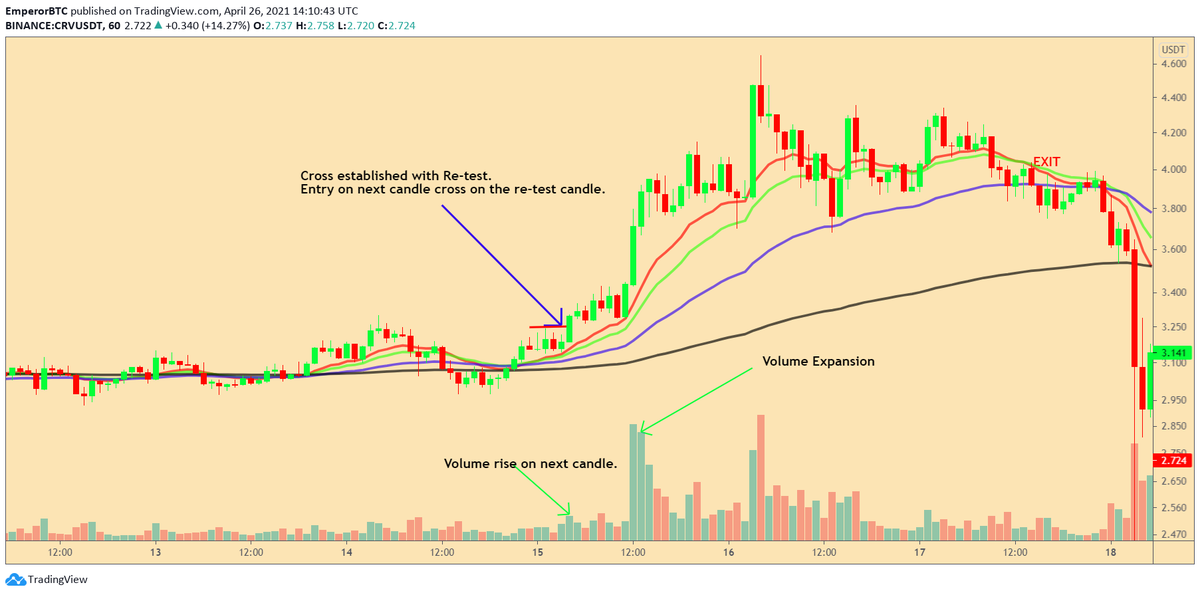
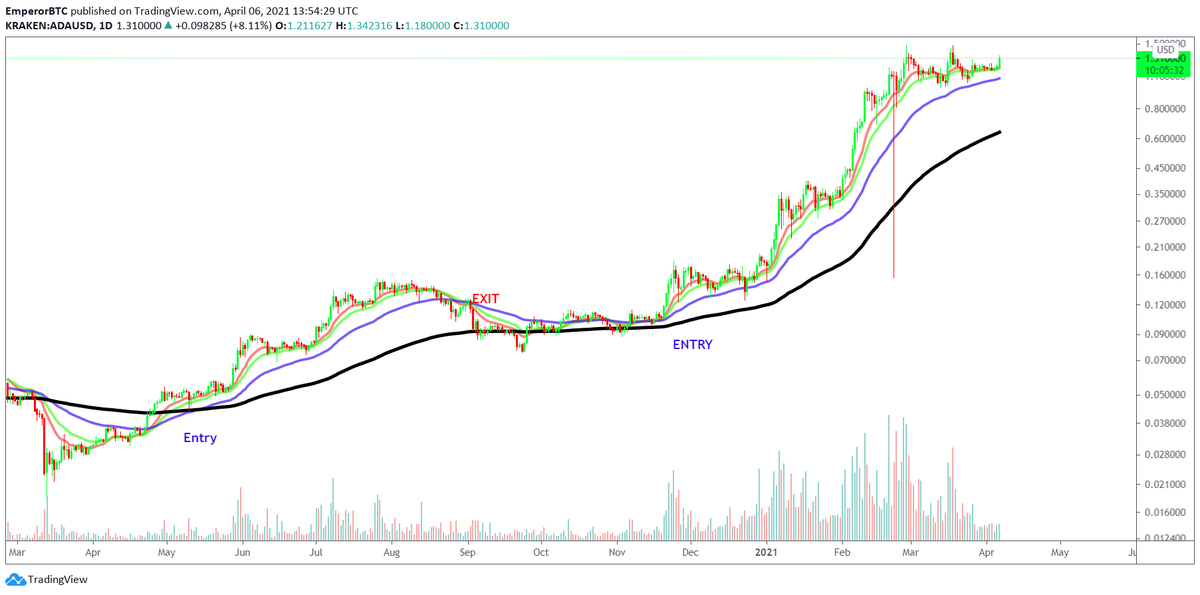
Go to 1-4 hour chart.
Use the following EMAs.
13,21,50,180.
Look for a period of consolidation and
13>21>50>180.
Wait for a pull back to 13EMA.
If bounce occurs with volume, Enter.
Exit on bearish cross with 21>13.
More from Emperor👑


🚨Altcoin Trading Indicator🚨
How to use it. A THREAD.
Please Share.
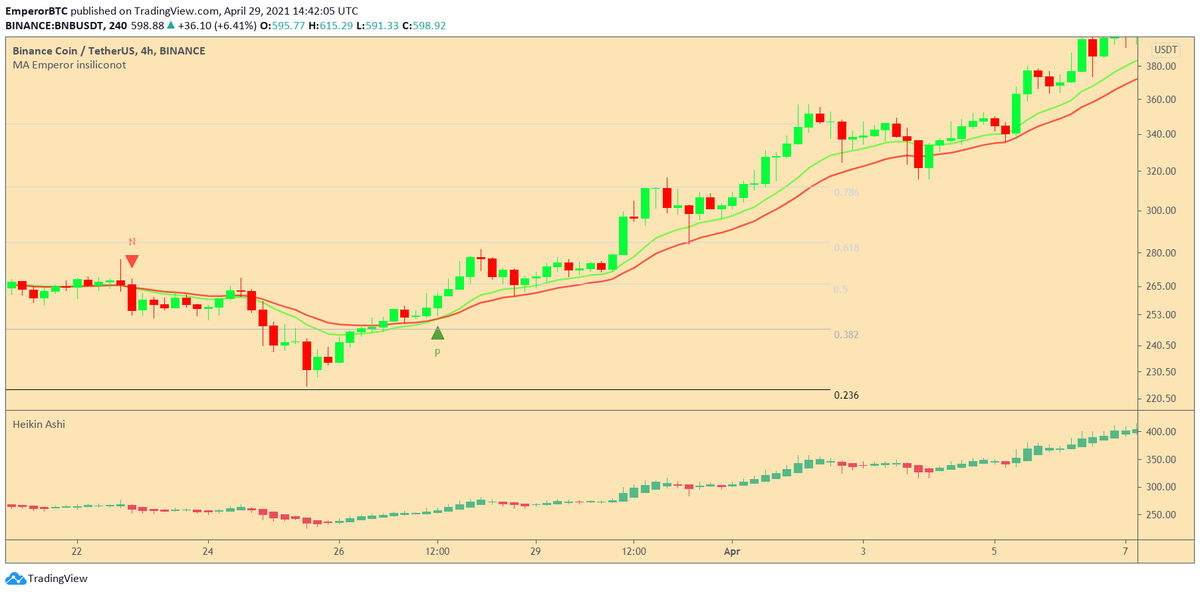
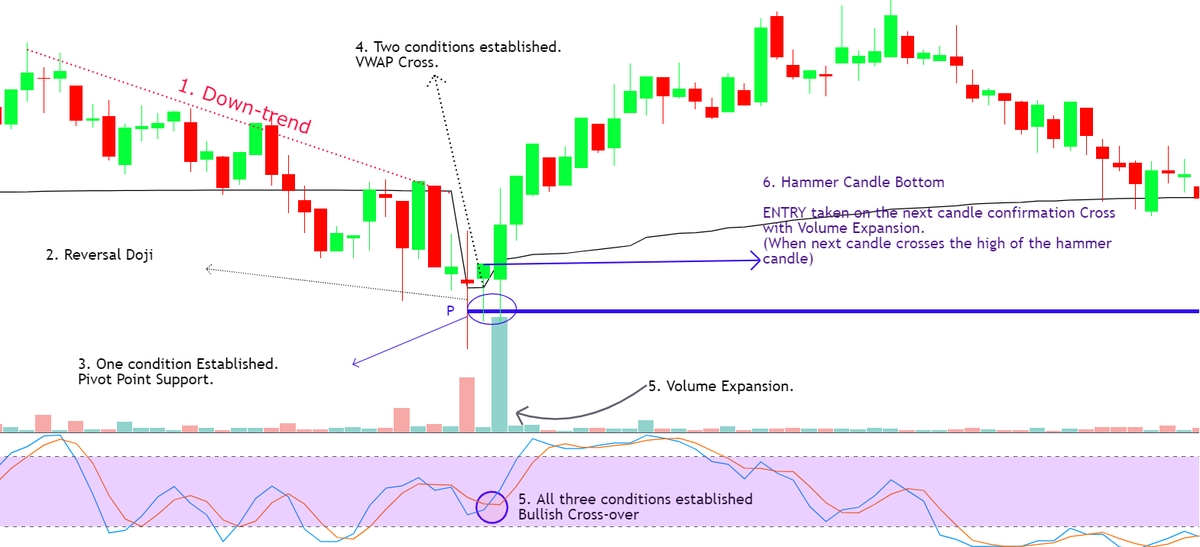
To use it to buy Altcoins and make a high probability entry, the following conditions needs to be fulfilled.
For a long.
1. A green candle Closes above the cross.
2. Heikin Ashi candle turns green.
3. Price should be above 0.236 Fib from the swing high.
How to add the Indicator.
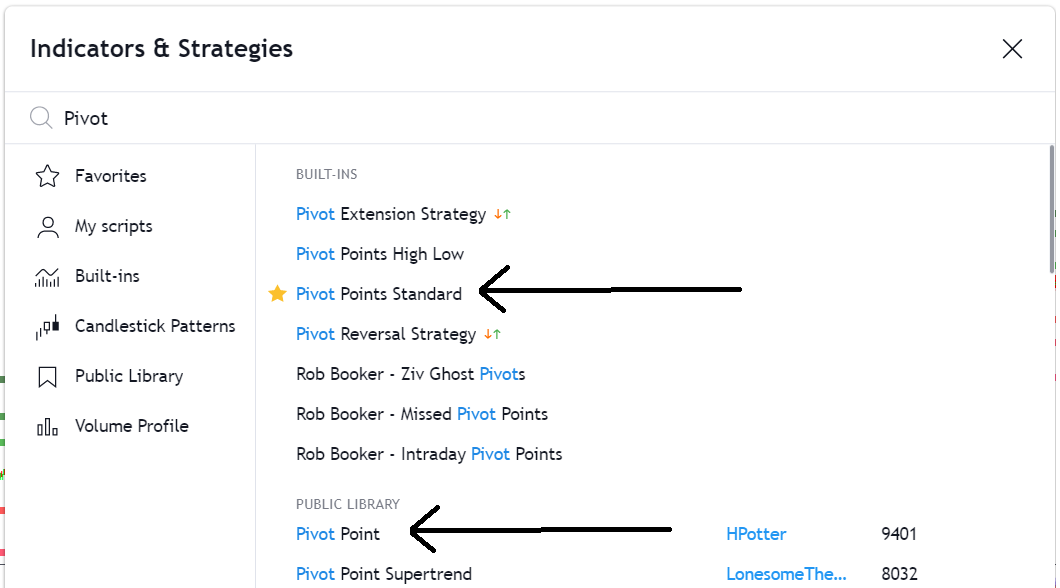
1. Click on the link and Add it to favorites and apply.
https://t.co/Kn90qgDjMi
2. Or Search it in the tab and then apply it.
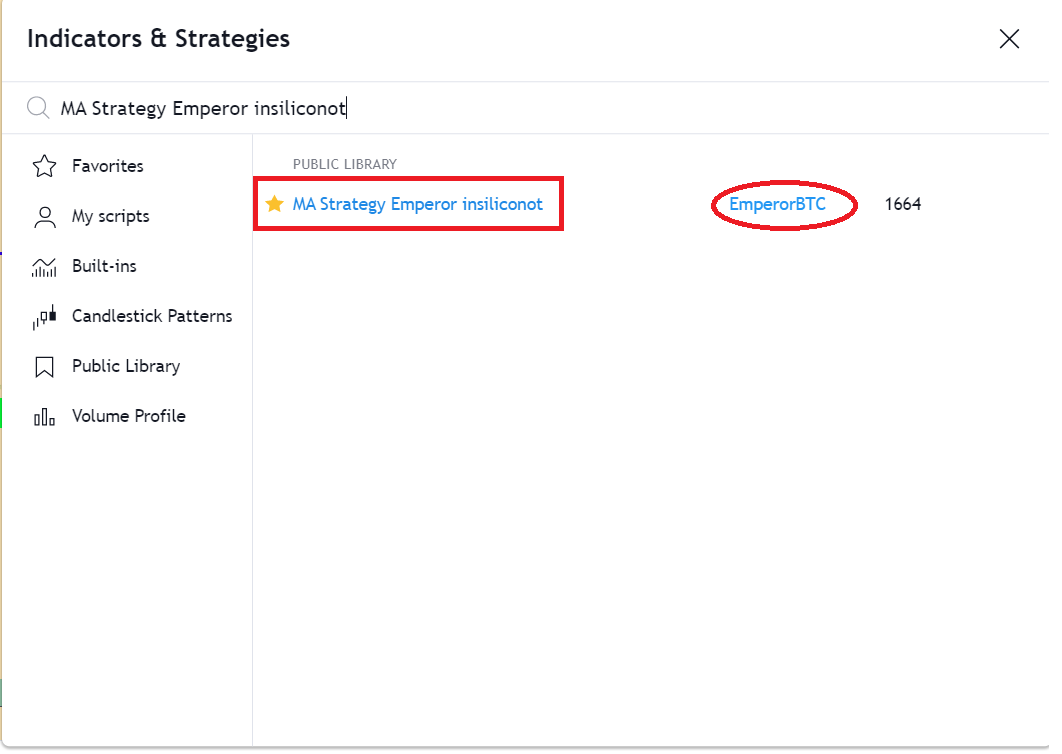
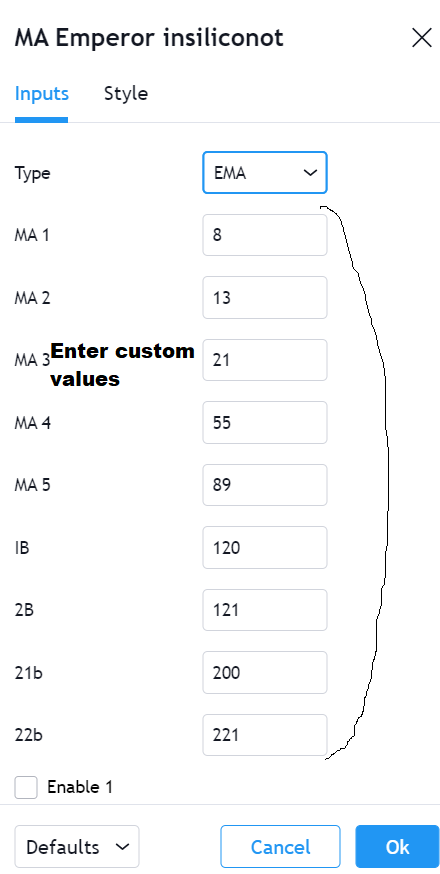
The indicator itself the most comprehensive Moving Average Indicator which provides 9 MAs and 13 Different times of MAs.
The base of the indicator was by @insiliconot.
To further enhance it, I have added a cross indicator on the cross which works the best historically on Alts.
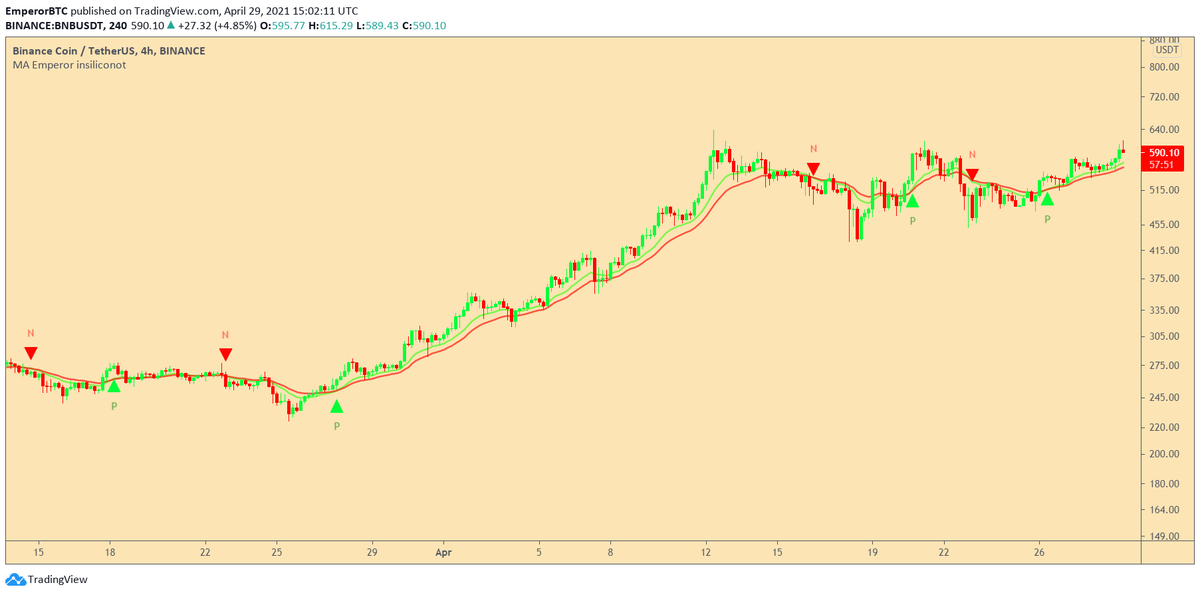
Condition 1- The cross.
Entry is made when a Cross occurs on the EMA 13/21.
The indicator automatically indicators the Cross with P for a positive cross or N for a negative cross.
This is the first condition for an Entry.
How to use it. A THREAD.
Please Share.
To use it to buy Altcoins and make a high probability entry, the following conditions needs to be fulfilled.
For a long.
1. A green candle Closes above the cross.
2. Heikin Ashi candle turns green.
3. Price should be above 0.236 Fib from the swing high.
How to add the Indicator.
1. Click on the link and Add it to favorites and apply.
https://t.co/Kn90qgDjMi
2. Or Search it in the tab and then apply it.
The indicator itself the most comprehensive Moving Average Indicator which provides 9 MAs and 13 Different times of MAs.
The base of the indicator was by @insiliconot.
To further enhance it, I have added a cross indicator on the cross which works the best historically on Alts.
Condition 1- The cross.
Entry is made when a Cross occurs on the EMA 13/21.
The indicator automatically indicators the Cross with P for a positive cross or N for a negative cross.
This is the first condition for an Entry.



More from Crypto

"Blockchain technology is energy-intensive..." => No, it doesn't have to be.
Let's look at Proof-Of-Stake, an alternative to the energy-intensive Proof-Of-Work algorithm.
🧵🔽
1️⃣ A Quick Recap On Proof-Of-Work
A Proof-Of-Work algorithm requires miners to do a certain amount of work that is compute-intensive to gain access to a service or the right to do something. This algorithm, by design, also requires that the work done shall not ...
... be reusable for anything else than what it was performed for. This lies at the core of the security concept of a blockchain. To gain the right to append a new block to a chain and to get some currency as a reward, there is work to be done, and this work must be verifyable.
That work is a race between different miners. Many miners try to compete and to be the first to find the answer to a problem presented to them. This implies that a lot of energy is wasted as only the first correct solution is accepted.
You can find a more detailed thread on Proof-Of-Work
Let's look at Proof-Of-Stake, an alternative to the energy-intensive Proof-Of-Work algorithm.
🧵🔽
1️⃣ A Quick Recap On Proof-Of-Work
A Proof-Of-Work algorithm requires miners to do a certain amount of work that is compute-intensive to gain access to a service or the right to do something. This algorithm, by design, also requires that the work done shall not ...
... be reusable for anything else than what it was performed for. This lies at the core of the security concept of a blockchain. To gain the right to append a new block to a chain and to get some currency as a reward, there is work to be done, and this work must be verifyable.
That work is a race between different miners. Many miners try to compete and to be the first to find the answer to a problem presented to them. This implies that a lot of energy is wasted as only the first correct solution is accepted.
You can find a more detailed thread on Proof-Of-Work
Proof-Of-Work is the name of a cryptographic algorithm that is used for some blockchains when new blocks are to be appended to the chain.
— Oliver Jumpertz (@oliverjumpertz) April 3, 2021
Let's take a higher-level look at how this one works, shall we?
\U0001f9f5\U0001f53d






0/ The Great Crypto Reversal
Key difference between the '17 and roaring 20s in crypto is that back then everyone was aping a16z and Naval.
Today everyone apes 3AC wanting to be the next Degen.
'17 was an idealistic *saving the world* kind of thing
20s is *me against the world*
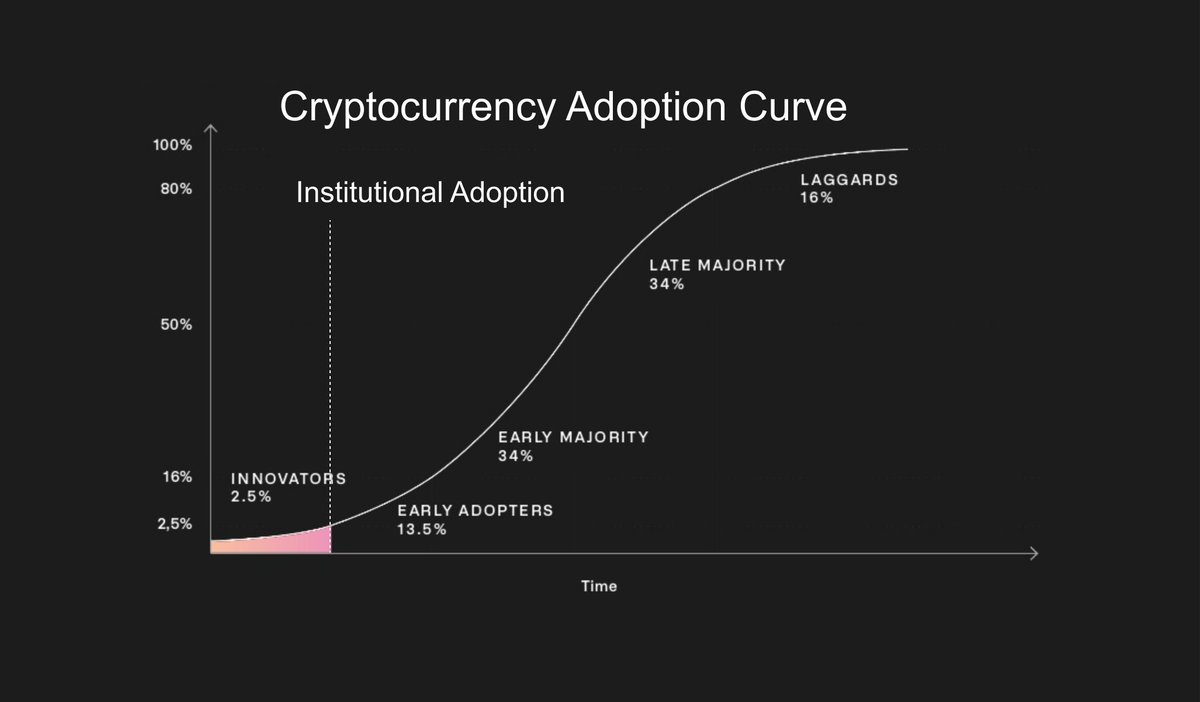
1/ The financialization of crypto means more volatility but pretty long ascend to the top.
Multi-year bull and an ATH surprising even to the biggest bulls as the infinite Cantillon "wealth" is pumped into crypto
Crypto becomes the ultimate Cantillon insider circle-jerk.
2/ This will be one the most iconic ideological reversals in history, comparable to Google who was firmly against advertising but turned into the most powerful ad company ever.

3/ This scenario reminds me of the 90s privatization period in the post-socialist countries.
The regime transition allowed the communist party elite to benefit from the wild west form of "capitalism" that ensued, transferring (and multiplying) their wealth into the new regime.
4/ We are far from Satoshi's original vision . But words and intentions of *prophets* were used to manipulate and corrupt all throughout human history and this time it is no
Key difference between the '17 and roaring 20s in crypto is that back then everyone was aping a16z and Naval.
Today everyone apes 3AC wanting to be the next Degen.
'17 was an idealistic *saving the world* kind of thing
20s is *me against the world*
1/ The financialization of crypto means more volatility but pretty long ascend to the top.
Multi-year bull and an ATH surprising even to the biggest bulls as the infinite Cantillon "wealth" is pumped into crypto
Crypto becomes the ultimate Cantillon insider circle-jerk.
2/ This will be one the most iconic ideological reversals in history, comparable to Google who was firmly against advertising but turned into the most powerful ad company ever.
3/ This scenario reminds me of the 90s privatization period in the post-socialist countries.
The regime transition allowed the communist party elite to benefit from the wild west form of "capitalism" that ensued, transferring (and multiplying) their wealth into the new regime.
4/ We are far from Satoshi's original vision . But words and intentions of *prophets* were used to manipulate and corrupt all throughout human history and this time it is no
At "forever" Cantillon insiders are infinitely wealthy. Everybody else lives in pods & eats what the livestock eats, or joins the harem or household staff of an infinitaire.
— Nick Szabo (@NickSzabo4) January 21, 2020