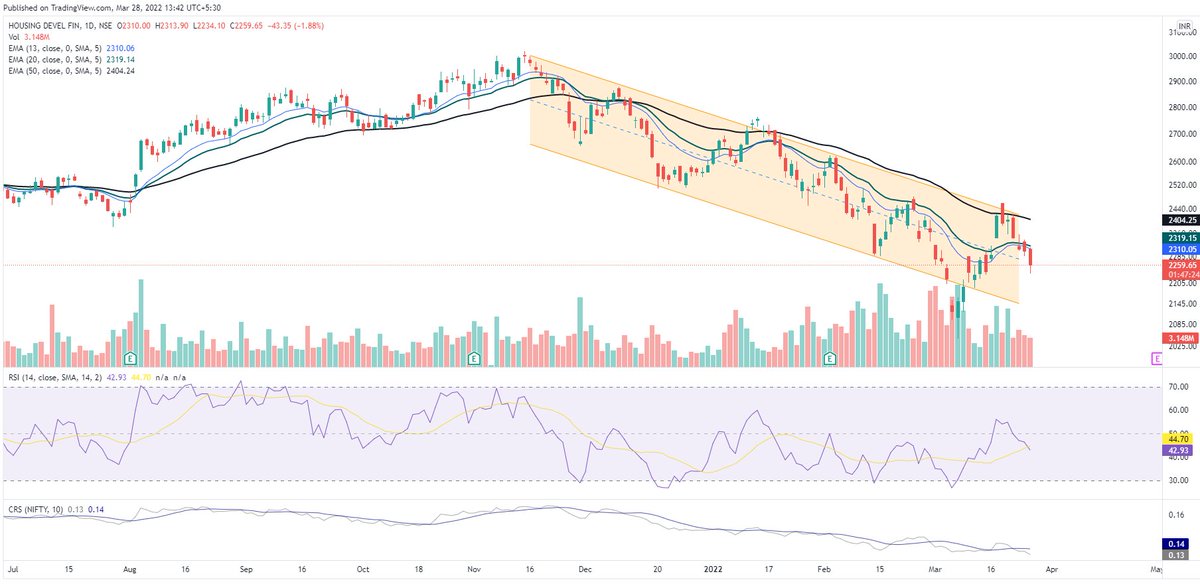
So, above Rs 250 Cr market cap (thats where I like to play mostly), out of 1168 companies:
> 40% correction : 6% companies
> 30% correction : 18% companies
> 20% correction : 45% companies
Not bad. So, almost evey second company is down by 20% from life time high
More from kumar saurabh
#AR2021 This will be master thread for all annual reports to be covered for 2021
#No 1 #Shreedigvijaycement
#No 2 #Bajajconsumer
#No 1 #Shreedigvijaycement
#AR2021 #Shreedigvijay cement. Started this year annual report reading with Digvijay cement. First time read a cement company AR. Some interesting comments on overall economy. Watch it herehttps://t.co/AQM2snbcHG pic.twitter.com/JL4lx26LlC
— kumar saurabh (@suru27) June 1, 2021
#No 2 #Bajajconsumer
#AR2021 #Bajajconsumer. 2nd company. Highlights - Rs 30 cr cost cutting sustainable ? Who gets Rs 8-9 Cr royalty benefit ? Who owns brand ? Why infra subsidiary with losses, intangible asset complexity ? Industry grown fat 2% in volume n 8% in value at 10 yr cagr pic.twitter.com/W4C0H2h8aV
— kumar saurabh (@suru27) June 7, 2021
#NASDAQ Will NASDAQ crash? How much more correction is to come? How to track?
An extended analysis of the morning tweet is in this Youtube video. Like and retweet for wider reach
morning tweet on NASDAQ
An extended analysis of the morning tweet is in this Youtube video. Like and retweet for wider reach
morning tweet on NASDAQ
#NASDAQ How much NASDAQ can fall?
— kumar saurabh (@suru27) June 14, 2022
Since 2000, this is the 3rd worst fall in NASDAQ
2000: 77% fall from peak
2008: 55% fall from peak
2022: 34% fall from peak pic.twitter.com/MO8KNtzQez
You May Also Like
1/OK, data mystery time.
This New York Times feature shows China with a Gini Index of less than 30, which would make it more equal than Canada, France, or the Netherlands. https://t.co/g3Sv6DZTDE
That's weird. Income inequality in China is legendary.
Let's check this number.
2/The New York Times cites the World Bank's recent report, "Fair Progress? Economic Mobility across Generations Around the World".
The report is available here:
3/The World Bank report has a graph in which it appears to show the same value for China's Gini - under 0.3.
The graph cites the World Development Indicators as its source for the income inequality data.
4/The World Development Indicators are available at the World Bank's website.
Here's the Gini index: https://t.co/MvylQzpX6A
It looks as if the latest estimate for China's Gini is 42.2.
That estimate is from 2012.
5/A Gini of 42.2 would put China in the same neighborhood as the U.S., whose Gini was estimated at 41 in 2013.
I can't find the <30 number anywhere. The only other estimate in the tables for China is from 2008, when it was estimated at 42.8.
This New York Times feature shows China with a Gini Index of less than 30, which would make it more equal than Canada, France, or the Netherlands. https://t.co/g3Sv6DZTDE
That's weird. Income inequality in China is legendary.
Let's check this number.
2/The New York Times cites the World Bank's recent report, "Fair Progress? Economic Mobility across Generations Around the World".
The report is available here:
3/The World Bank report has a graph in which it appears to show the same value for China's Gini - under 0.3.
The graph cites the World Development Indicators as its source for the income inequality data.
4/The World Development Indicators are available at the World Bank's website.
Here's the Gini index: https://t.co/MvylQzpX6A
It looks as if the latest estimate for China's Gini is 42.2.
That estimate is from 2012.
5/A Gini of 42.2 would put China in the same neighborhood as the U.S., whose Gini was estimated at 41 in 2013.
I can't find the <30 number anywhere. The only other estimate in the tables for China is from 2008, when it was estimated at 42.8.