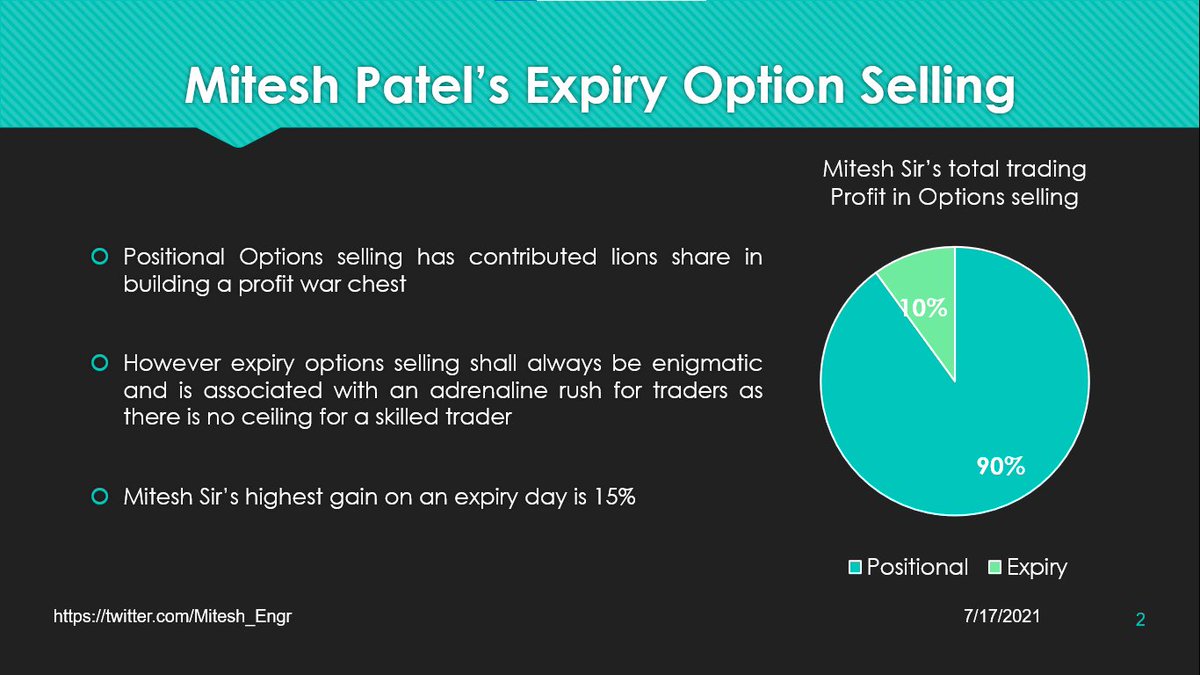
So, above Rs 250 Cr market cap (thats where I like to play mostly), out of 1168 companies, change in last 1 week
> 40% correction : 6 to 7%
> 30% correction : 18 to 21%
> 20% correction : 45 to 57%
Bulk of correction between 20-30% from highs
So, above Rs 250 Cr market cap (thats where I like to play mostly), out of 1168 companies:
— kumar saurabh (@suru27) November 22, 2021
> 40% correction : 6% companies
> 30% correction : 18% companies
> 20% correction : 45% companies
Not bad. So, almost evey second company is down by 20% from life time high
More from kumar saurabh
#No 1 #Shreedigvijaycement
#AR2021 #Shreedigvijay cement. Started this year annual report reading with Digvijay cement. First time read a cement company AR. Some interesting comments on overall economy. Watch it herehttps://t.co/AQM2snbcHG pic.twitter.com/JL4lx26LlC
— kumar saurabh (@suru27) June 1, 2021
#No 2 #Bajajconsumer
#AR2021 #Bajajconsumer. 2nd company. Highlights - Rs 30 cr cost cutting sustainable ? Who gets Rs 8-9 Cr royalty benefit ? Who owns brand ? Why infra subsidiary with losses, intangible asset complexity ? Industry grown fat 2% in volume n 8% in value at 10 yr cagr pic.twitter.com/W4C0H2h8aV
— kumar saurabh (@suru27) June 7, 2021
You May Also Like


If everyone was holding bitcoin on the old x86 in their parents basement, we would be finding a price bottom. The problem is the risk is all pooled at a few brokerages and a network of rotten exchanges with counter party risk that makes AIG circa 2008 look like a good credit.
— Greg Wester (@gwestr) November 25, 2018
The benign product is sovereign programmable money, which is historically a niche interest of folks with a relatively clustered set of beliefs about the state, the literary merit of Snow Crash, and the utility of gold to the modern economy.
This product has narrow appeal and, accordingly, is worth about as much as everything else on a 486 sitting in someone's basement is worth.
The other product is investment scams, which have approximately the best product market fit of anything produced by humans. In no age, in no country, in no city, at no level of sophistication do people consistently say "Actually I would prefer not to get money for nothing."
This product needs the exchanges like they need oxygen, because the value of it is directly tied to having payment rails to move real currency into the ecosystem and some jurisdictional and regulatory legerdemain to stay one step ahead of the banhammer.

On Sunday 21st June, 14 year old Noah Donohoe left his home to meet his friends at Cave Hill Belfast to study for school. #RememberMyNoah💙

He was on his black Apollo mountain bike, fully dressed, wearing a helmet and carrying a backpack containing his laptop and 2 books with his name on them. He also had his mobile phone with him.
On the 27th of June. Noah's naked body was sadly discovered 950m inside a storm drain, between access points. This storm drain was accessible through an area completely unfamiliar to him, behind houses at Northwood Road. https://t.co/bpz3Rmc0wq
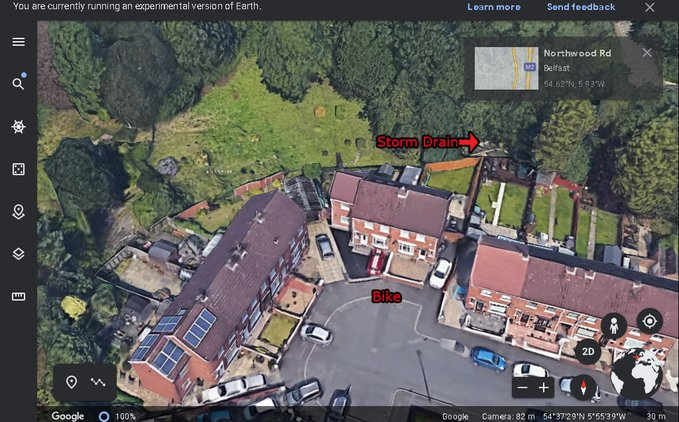
"Noah's body was found by specially trained police officers between two drain access points within a section of the tunnel running under the Translink access road," said Mr McCrisken."
Noah's bike was also found near a house, behind a car, in the same area. It had been there for more than 24 hours before a member of public who lived in the street said she read reports of a missing child and checked the bike and phoned the police.