
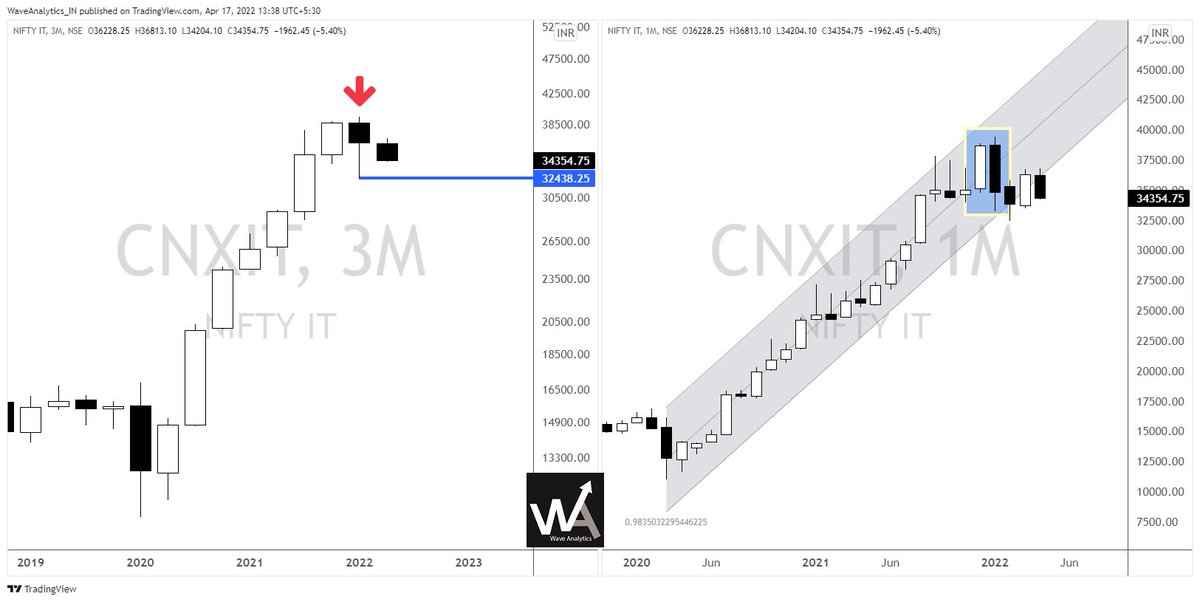
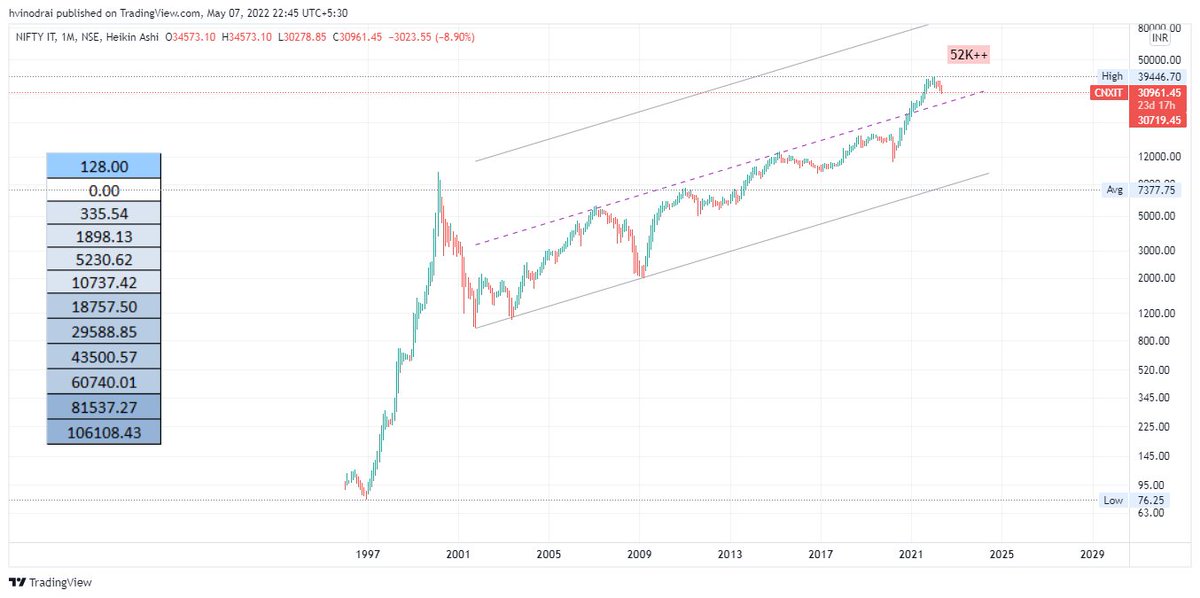
IT Index, the original leader of the rally from Mar'20, now seems to be exhausted / giving up.
With a Hanging Man on Quarterly, it now seems to be breaking out of the rising regression channel post Tweezer Top candles on Monthly charts.
More from Piyush Chaudhry
In such a case, H&S can be either a continuation pattern or compound fulcrum.
This is how to differentiate:
• if right shoulder is smaller than left, most likely a continuation H&S
• if right is same or higher than left, and the price is not coming to neckline, most likely CF
This is how to differentiate:
• if right shoulder is smaller than left, most likely a continuation H&S
• if right is same or higher than left, and the price is not coming to neckline, most likely CF
sir a doubt does head & shoulders work in down trend ? pic.twitter.com/dytYmbzOfp
— Vega_Greek (@VegaGreek) May 13, 2021

#repost
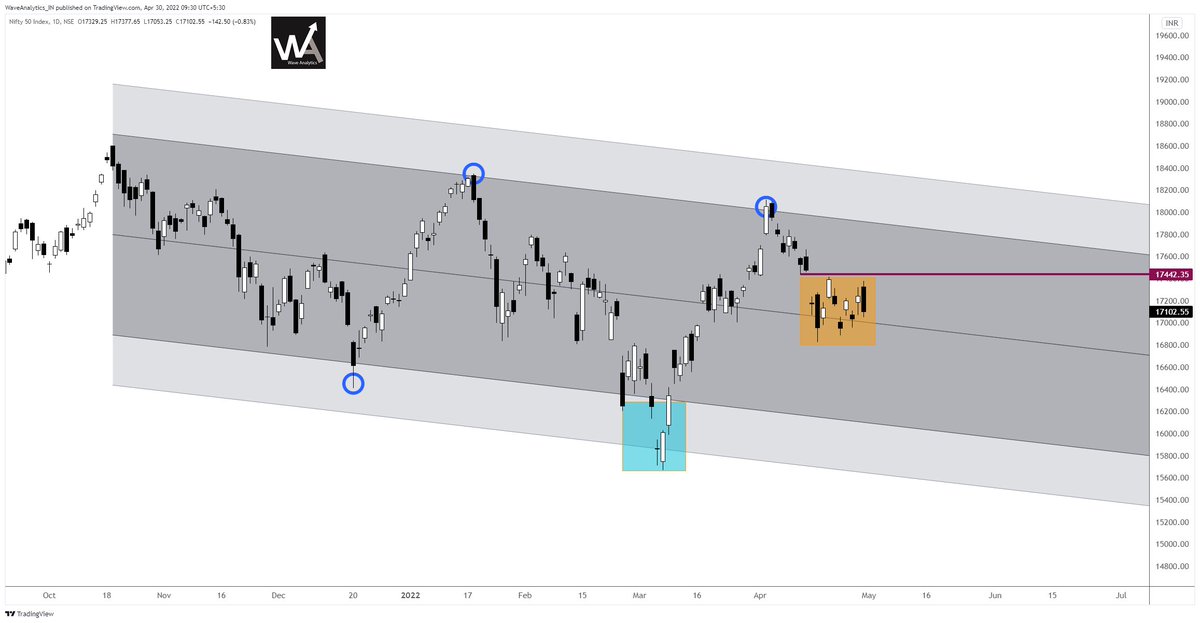
On the last two instances, when #Brent #CrudeOil crossed 90, NIFTY (in Blue - Left scale) underwent Correction both the times. This is the third such instance.
— Piyush Chaudhry (@piyushchaudhry) February 12, 2022
Below 90, NIFTY & Brent have had positive correlation, with 90 acting as an inflection point & causing the Divergence. pic.twitter.com/Q9dj8YFpuV
More from Cnxitlongterm

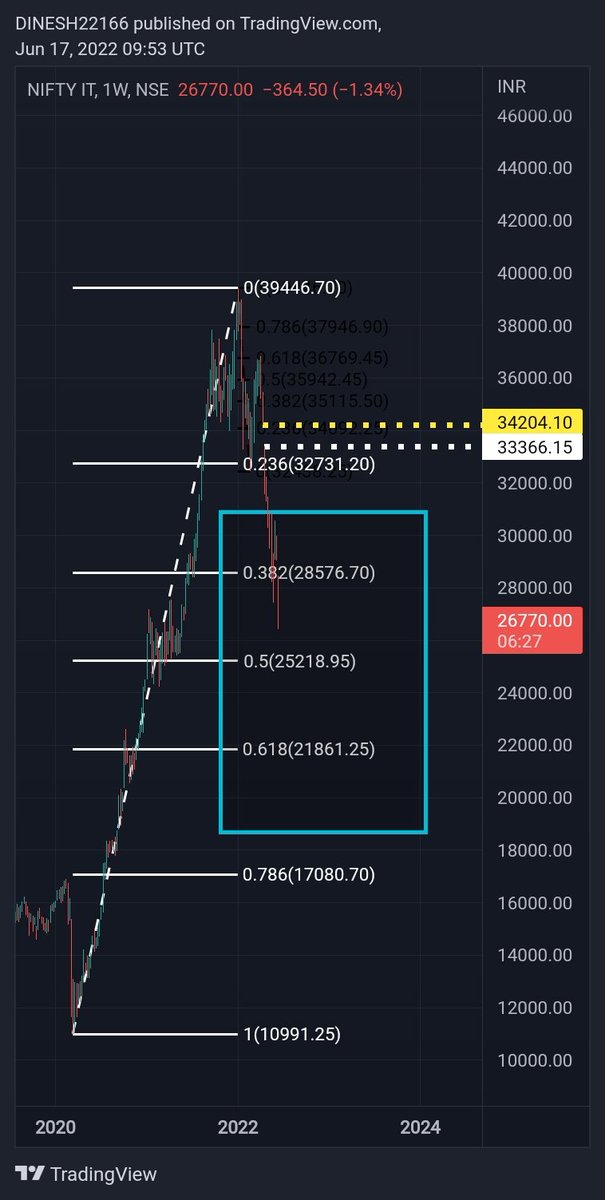


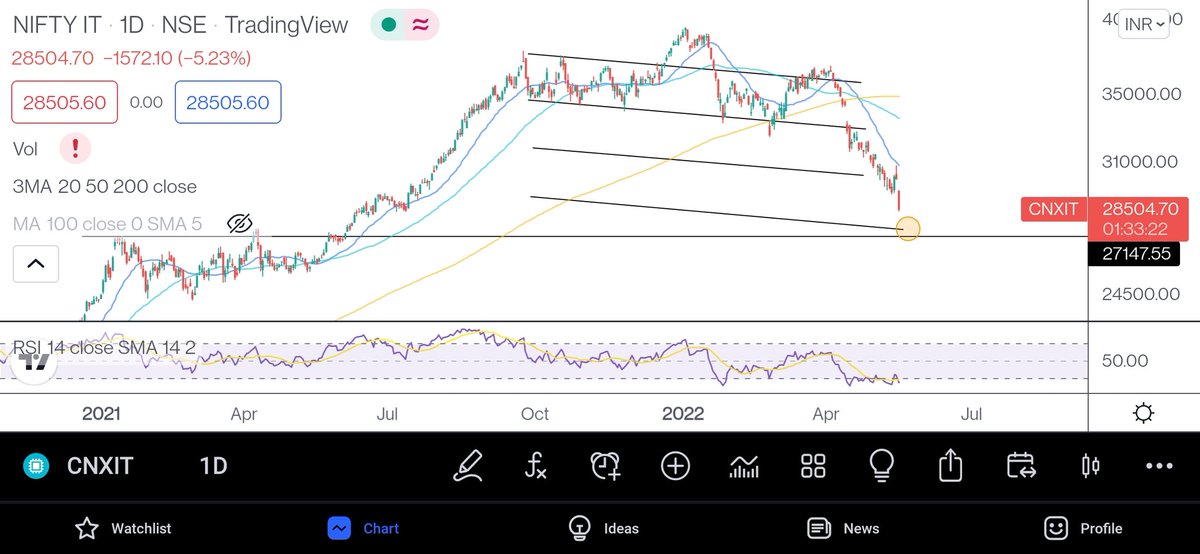
Parabolic move has been triggered. Let's have 27k. That could be the buying zone for IT names.
#CNXIT https://t.co/bJeKTMoCji
#CNXIT https://t.co/bJeKTMoCji
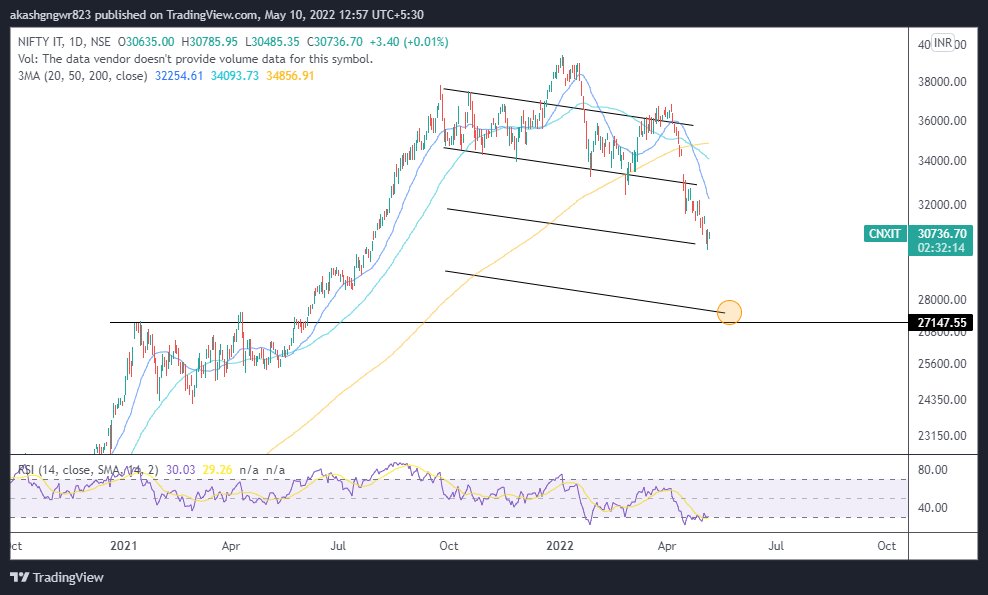
The current formation might look like a falling wedge, but the way moving averages are placed, it looks like a falling wedge which can lead to a parabolic downmove for the marked target. #CNXIT pic.twitter.com/GmXOI3HmUN
— Aakash Gangwar (@akashgngwr823) May 10, 2022

You May Also Like






Facebook originally a CIA program called "LifeLog".
LifeLog, via DARPA, terminated on Feb 4th, 2004.
Facebook was launched on Feb 4th, 2004.
Many of the LifeLog team became execs at FB.
Zuckerberg is a figurehead.
CIA allowed Cambridge to help Trump win
https://t.co/enzOXDCogV

Pentagon Kills LifeLog
LifeLog, via DARPA, terminated on Feb 4th, 2004.
Facebook was launched on Feb 4th, 2004.
Many of the LifeLog team became execs at FB.
Zuckerberg is a figurehead.
CIA allowed Cambridge to help Trump win
https://t.co/enzOXDCogV
Project: Lifelog
— Robert Horan (@Robby12692) December 13, 2018
Started by DARPA in 1999, the goal of Lifelog was to create a database on civilians without their knowledge, and track everything they do.
The project "ended" on Feb 4th, 2004.
Facebook began the exact same day.
The CIA funneled tens of millions into Facebook. pic.twitter.com/r7hwF0v9kh
Pentagon Kills LifeLog