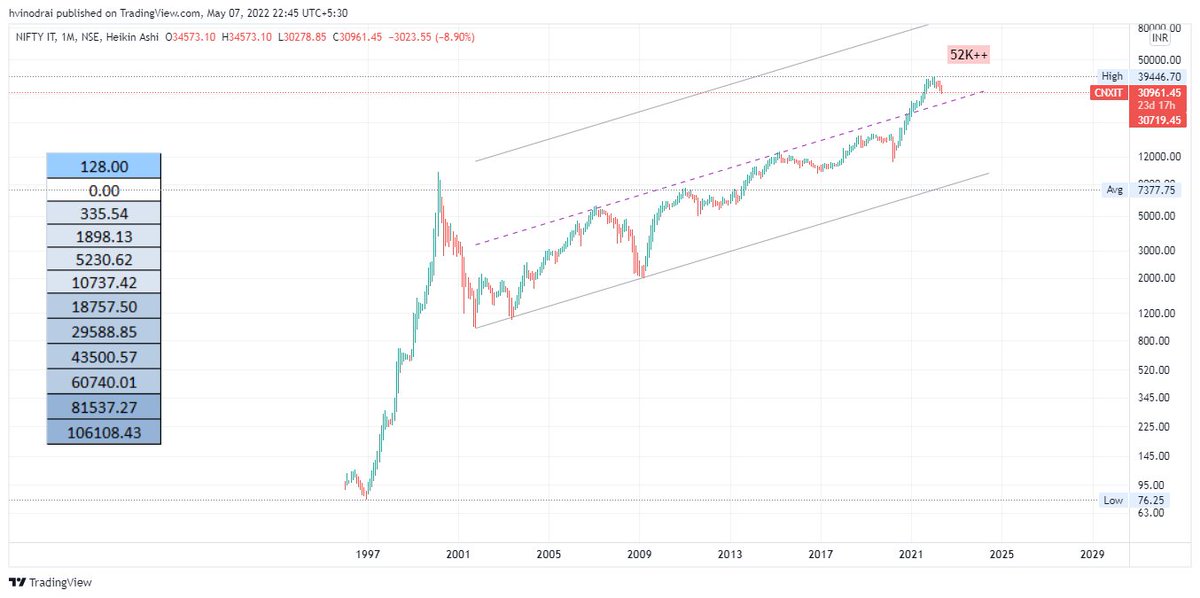
When short term gets confusing, zoom out to long term charts. #Nifty
#CNXIT still must do a minimum 52K++ (to complete its move from Oct 2001 low) & therefore any dip between 26K-29K is a good buy zone. Also has mid-line support right there (previously resistance).
More from Harsh / 허쉬
More from Cnxitlongterm

What happened to IEX can happen to CNXIT. Savdhaan rahe, satark rahe. Reiterating it again, every falling wedge/channel, RSI divergence is not a reversal signal.
#CNXIT
#CNXIT
Watching the marked zone to be tested. If it doesn't cross it, then most probably a parabolic downmove towards 24k. That would lead to even large caps cracking just like Small and Midcaps. #CNXIT https://t.co/FxbzP5vlBr pic.twitter.com/FSqcSqTQM9
— Aakash Gangwar (@akashgngwr823) June 21, 2022

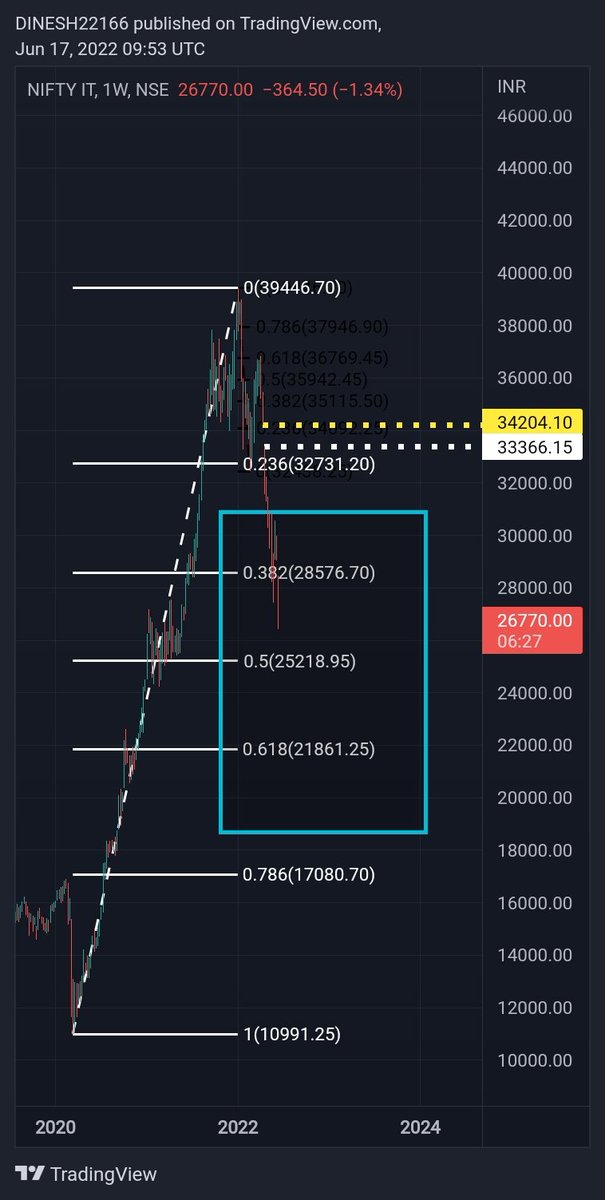
One of the best risk reward long setups coming soon in IT sector. Let's time the bottom this time. Expecting a minimum of 5k-6k pts rally in Nifty IT after hitting the zone of 26.5k-27k
#CNXIT
#CNXIT
Parabolic move has been triggered. Let's have 27k. That could be the buying zone for IT names. #CNXIT https://t.co/bJeKTMoCji pic.twitter.com/ab6w1mysz0
— Aakash Gangwar (@akashgngwr823) May 19, 2022