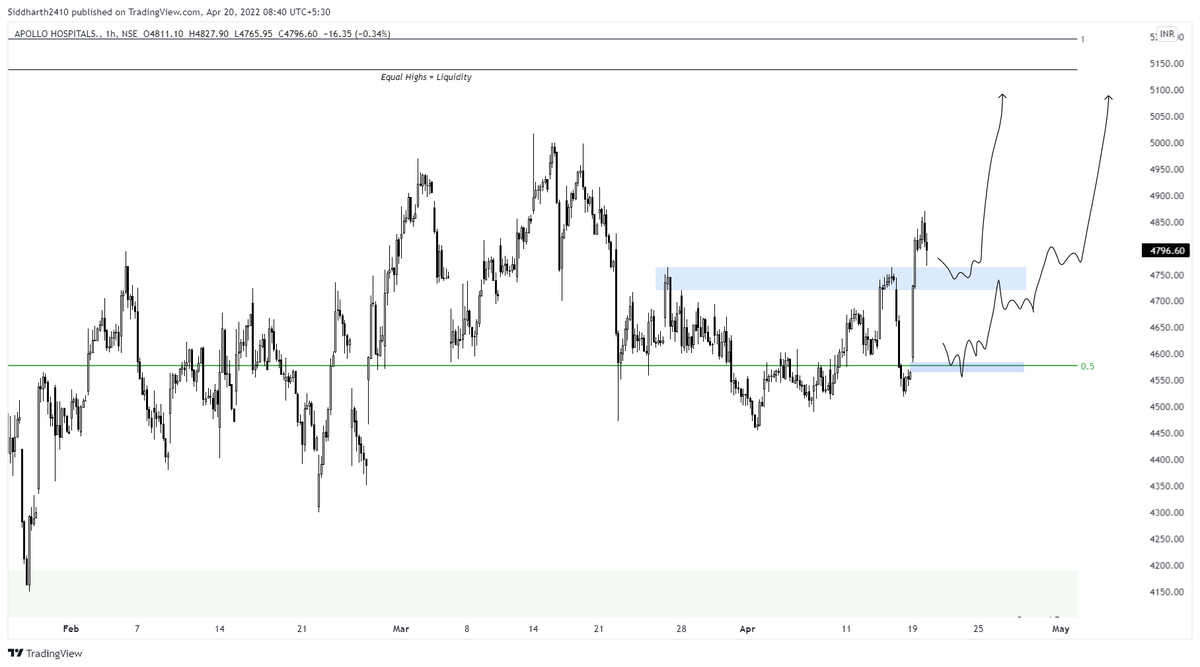
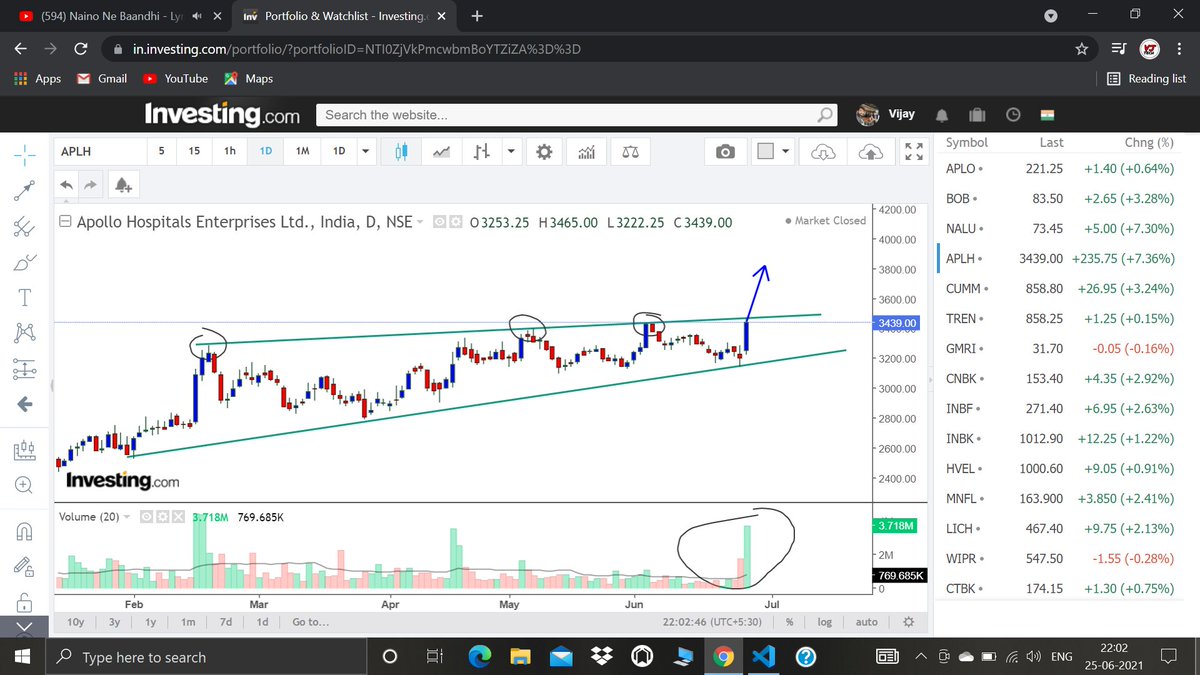
TRIGGERED!
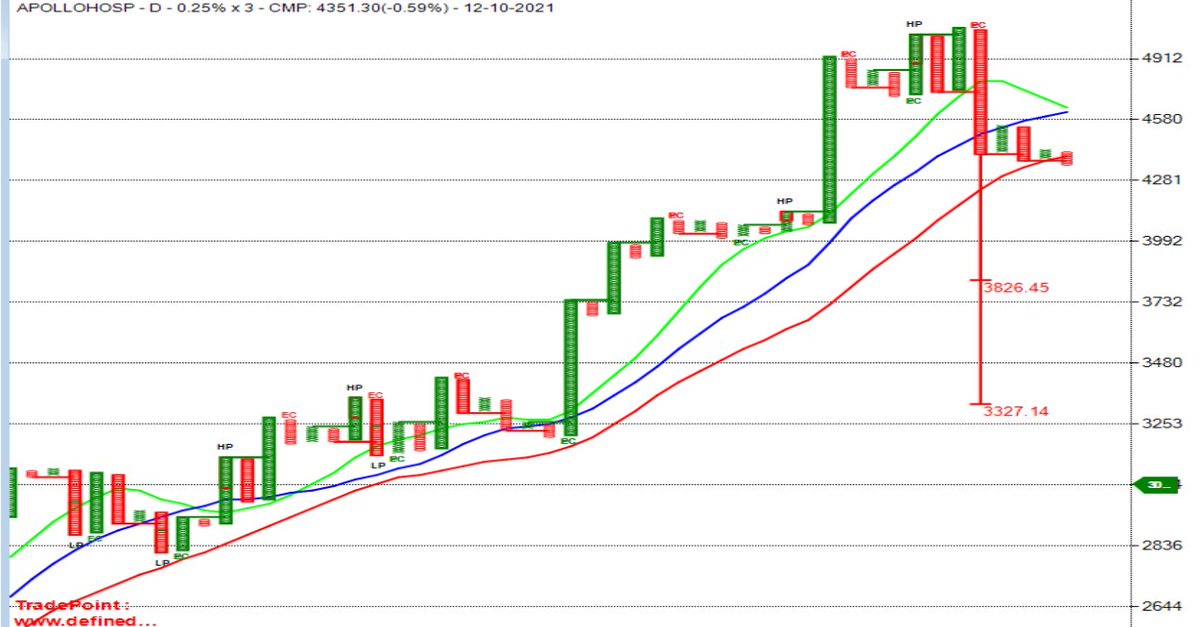
APOLLOHOSP
— Saket Reddy (@saketreddy) August 31, 2021
Double Top Buy & T20 Pattern - Bullish above 4951.93 daily close on 1% Box Size chart. https://t.co/P2gzMMcjws pic.twitter.com/pXnjGSsYE6
More from Saket Reddy
Double Top Buy above 2233.36 daily close on 1% Box size chart. https://t.co/Grtz9Pi3vU
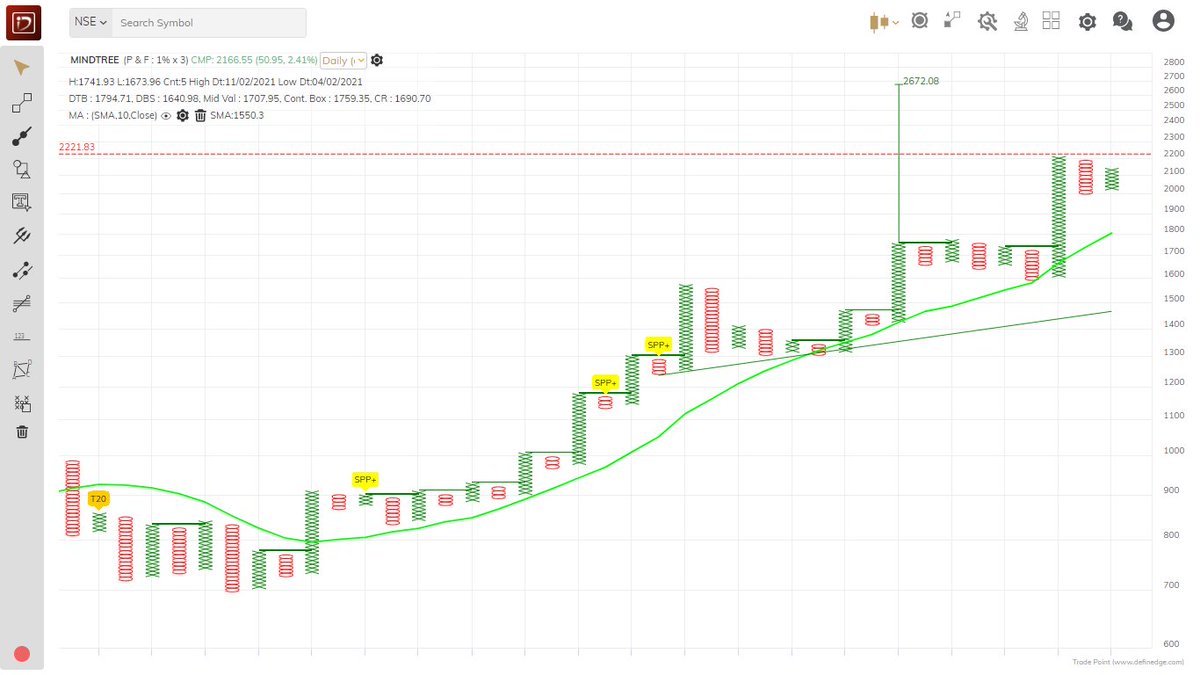
MINDTREE
— Saket Reddy (@saketreddy) December 22, 2020
The company is an international information technology consulting and implementation organisation that delivers business solutions through global software development.
DTB above 1619.22 daily close on 3% box size chart, DTB active on 1% chart. https://t.co/dhQmouQ9Wt pic.twitter.com/g8Rgz7fA0A
Don't try bottom fishing and value buying as time correction can take away a lot of opportunity cost.
Just let it give a monthly or weekly close above ATH.
ABBOTINDIA
— Saket Reddy (@saketreddy) May 8, 2021
A breakout in the offing? pic.twitter.com/rnpcsQ616a


More from Apollohospitals


You May Also Like


1. IQ is one of the most heritable psychological traits – that is, individual differences in IQ are strongly associated with individual differences in genes (at least in fairly typical modern environments). https://t.co/3XxzW9bxLE
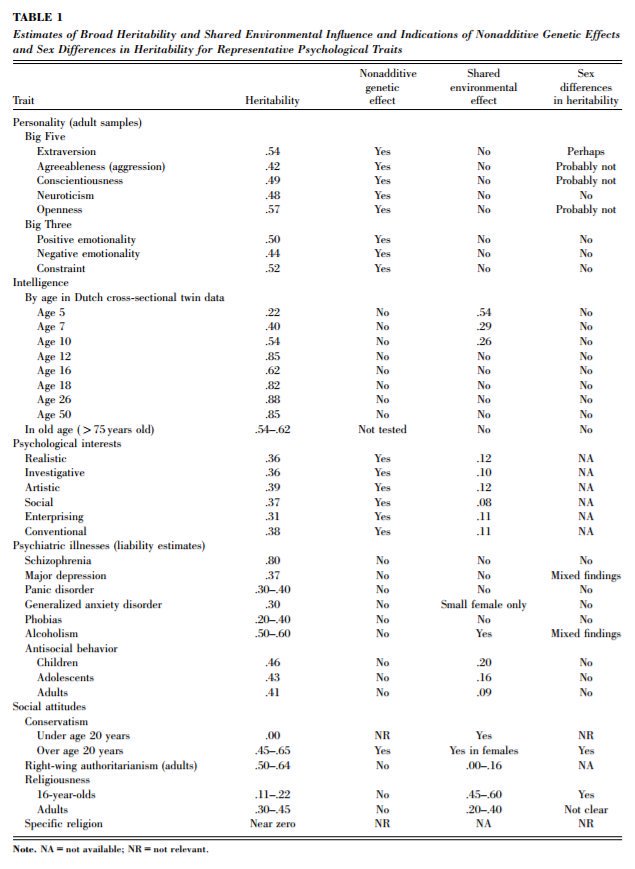
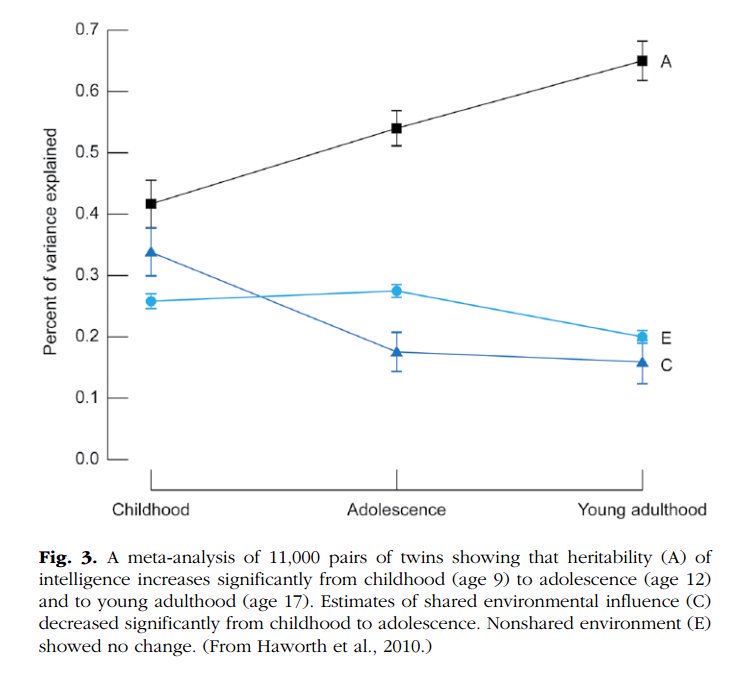
2. The heritability of IQ *increases* from childhood to adulthood. Meanwhile, the effect of the shared environment largely fades away. In other words, when it comes to IQ, nature becomes more important as we get older, nurture less. https://t.co/UqtS1lpw3n
3. IQ scores have been increasing for the last century or so, a phenomenon known as the Flynn effect. https://t.co/sCZvCst3hw (N ≈ 4 million)
(Note that the Flynn effect shows that IQ isn't 100% genetic; it doesn't show that it's 100% environmental.)
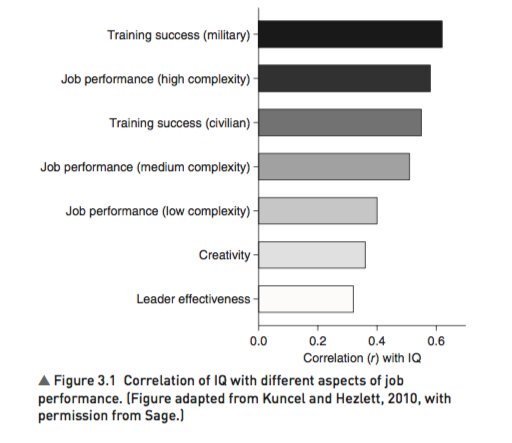
4. IQ predicts many important real world outcomes.
For example, though far from perfect, IQ is the single-best predictor of job performance we have – much better than Emotional Intelligence, the Big Five, Grit, etc. https://t.co/rKUgKDAAVx https://t.co/DWbVI8QSU3
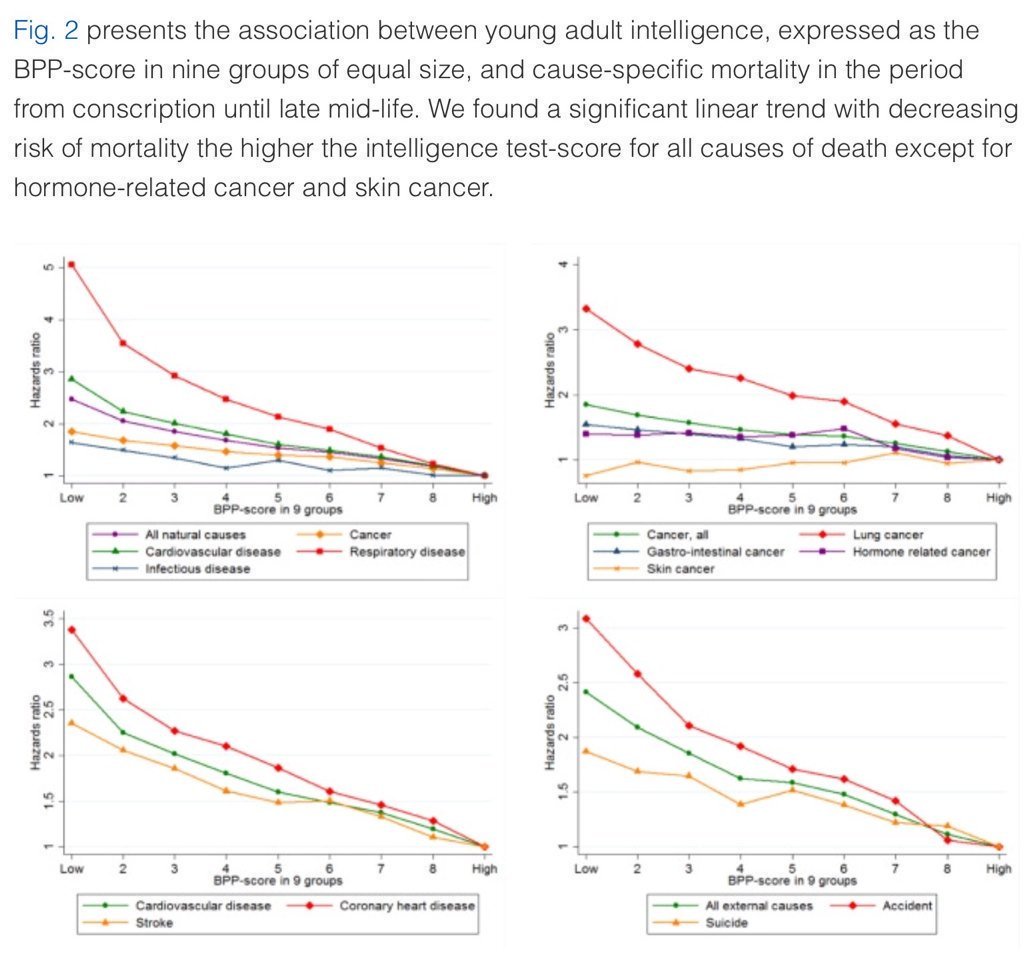
5. Higher IQ is associated with a lower risk of death from most causes, including cardiovascular disease, respiratory disease, most forms of cancer, homicide, suicide, and accident. https://t.co/PJjGNyeQRA (N = 728,160)


Those who exited at 1500 needed money. They can always come back near 969. Those who exited at 230 also needed money. They can come back near 95.
Those who sold L @ 660 can always come back at 360. Those who sold S last week can be back @ 301
Sir, Log yahan.. 13 days patience nhi rakh sakte aur aap 2013 ki baat kar rahe ho. Even Aap Ready made portfolio banakar bhi de do to bhi wo 1 month me hi EXIT kar denge \U0001f602
— BhavinKhengarSuratGujarat (@IntradayWithBRK) September 19, 2021
Neuland 2700 se 1500 & Sequent 330 to 230 kya huwa.. 99% retailers/investors twitter par charcha n EXIT\U0001f602