ApolloHospital
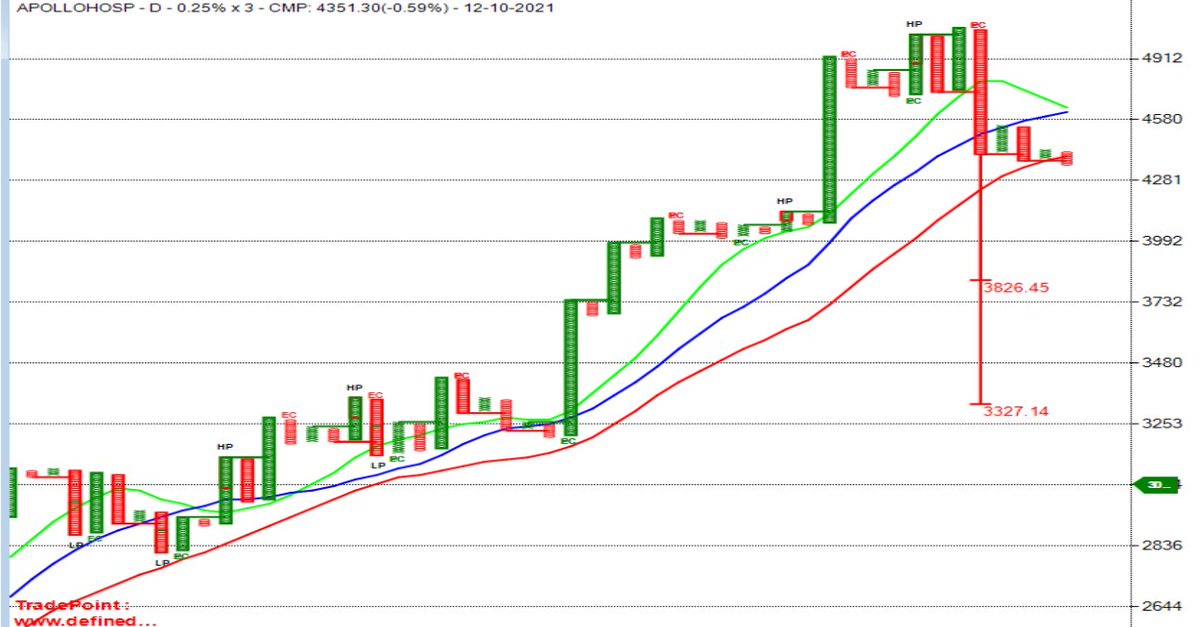
Looks bearish and could test 3827.
Cmp 4377, if it manages to close above 4433, then trade fails.
More from Abhishek

Nifty Futures Positional Trading Using Point & Figure Charts
Following this system on stocks since 2021 and started on Index in 2022
Based on Richard Dennis's Turtle Trading System and the P&F version was created by @Prashantshah267
Details
Chart Settings
Instrument: Nifty Futures ( Current Month)
Chart : Point & Figure
Box Size: 0.10%
Reversal Box: 3
Data Frequency- 1 Min
P&F Charts don't have concept of time but it has a concept Data Frequency, i.e. duration after which to consider plotting X or O on the chart
Since DF is 1 Min here, so we need to wait for 1 Min closing on P&F Charts for Entry, Exit Signals
The chart is an Intraday Chart & requires Intraday data
Which is available on the Real Time Tradepoint Software & on the Web Version of this software
https://t.co/oAshC7rfD1
-
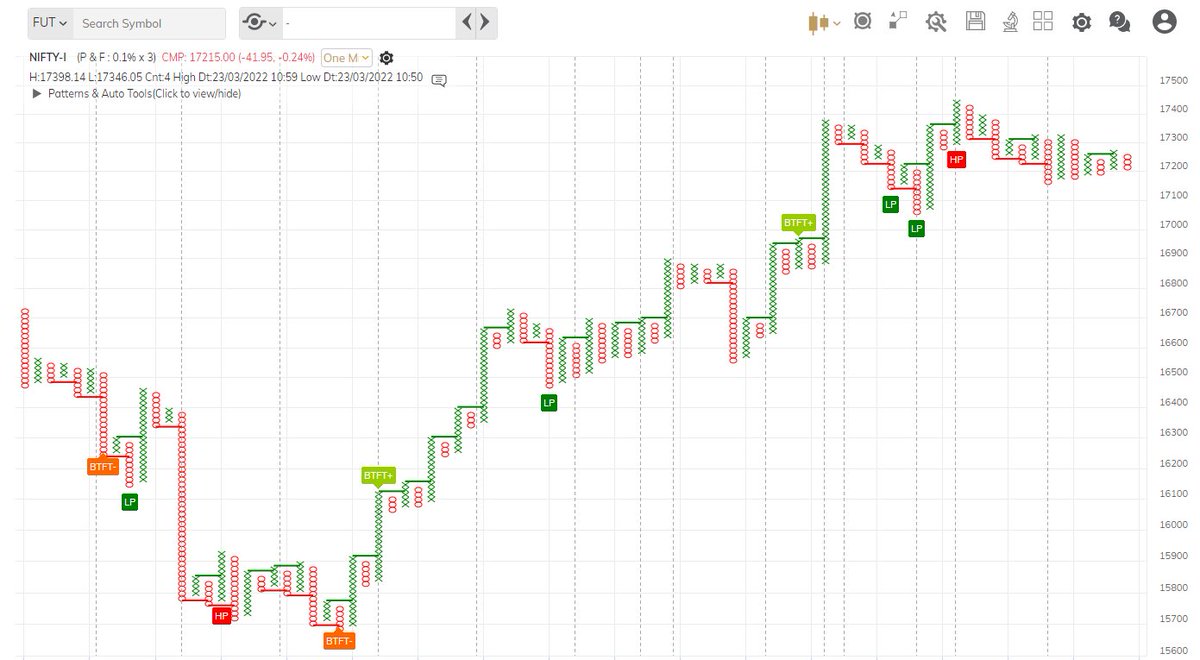
Let's now Discuss Bullish Entry Pattern
The Entry Pattern is called as a Bullish Follow Through Turtle Buy Pattern
This actually comprises of 2 Parts
1. Bullish Turtle Breakout
2. Bullish Turtle Follow Through
For Entry, #1 must happen and there must be a #2 immediately
First Let's Understand the Bullish Turtle Breakout Pattern
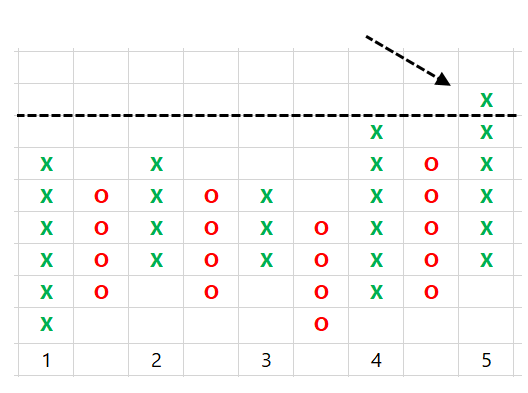
This is a 5 X BO Pattern
If current column of X goes above highest ‘X’ in last 5 columns (including current column), then it is a 5-X Turtle breakout.
Following this system on stocks since 2021 and started on Index in 2022
Based on Richard Dennis's Turtle Trading System and the P&F version was created by @Prashantshah267
Details
Chart Settings
Instrument: Nifty Futures ( Current Month)
Chart : Point & Figure
Box Size: 0.10%
Reversal Box: 3
Data Frequency- 1 Min
P&F Charts don't have concept of time but it has a concept Data Frequency, i.e. duration after which to consider plotting X or O on the chart
Since DF is 1 Min here, so we need to wait for 1 Min closing on P&F Charts for Entry, Exit Signals
The chart is an Intraday Chart & requires Intraday data
Which is available on the Real Time Tradepoint Software & on the Web Version of this software
https://t.co/oAshC7rfD1
-
Let's now Discuss Bullish Entry Pattern
The Entry Pattern is called as a Bullish Follow Through Turtle Buy Pattern
This actually comprises of 2 Parts
1. Bullish Turtle Breakout
2. Bullish Turtle Follow Through
For Entry, #1 must happen and there must be a #2 immediately
First Let's Understand the Bullish Turtle Breakout Pattern
This is a 5 X BO Pattern
If current column of X goes above highest ‘X’ in last 5 columns (including current column), then it is a 5-X Turtle breakout.

More from Apollohospitals



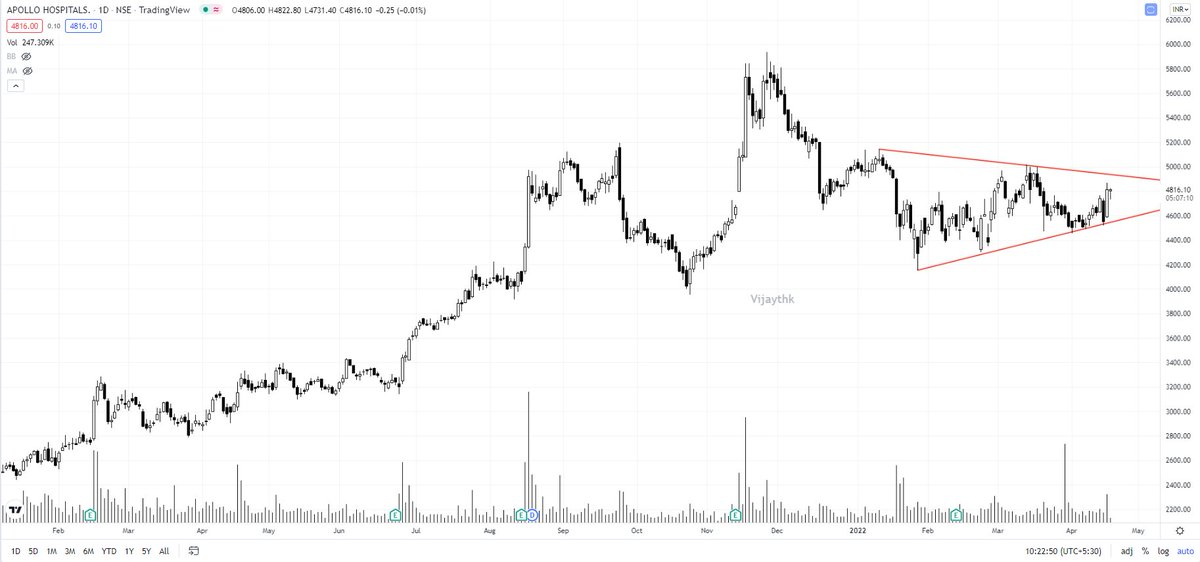

Almost 3 months taken.
Apollo Hospitals 2915 to 3450, near target.
SL of just 2.5% was not breached for 3 months, imagine the strength in this counter since then.
Net returns nearly 20% in 3 months.
Apollo Hospitals 2915 to 3450, near target.
SL of just 2.5% was not breached for 3 months, imagine the strength in this counter since then.
Net returns nearly 20% in 3 months.
Apollo Hospitals
— Prem Doshi \U0001f1ee\U0001f1f3 (@StocksResearch) April 5, 2021
CMP 2915
SL of 2840
Target 3500+
Covid wave 2 causing a sharp rally in diagnostic lab stocks, should spill over to hospital stocks too, apollo the only F&O stock in hospital sector. pic.twitter.com/F6tS8TX1s2

On track to 5850...
As per traditional chart analysis, the breakout from the flag can extend by a distance of the flagpole which gives us the price objective of 5850 or thereabouts.
Let's see what happens!
#ApolloHospital https://t.co/jHgjR2WThe
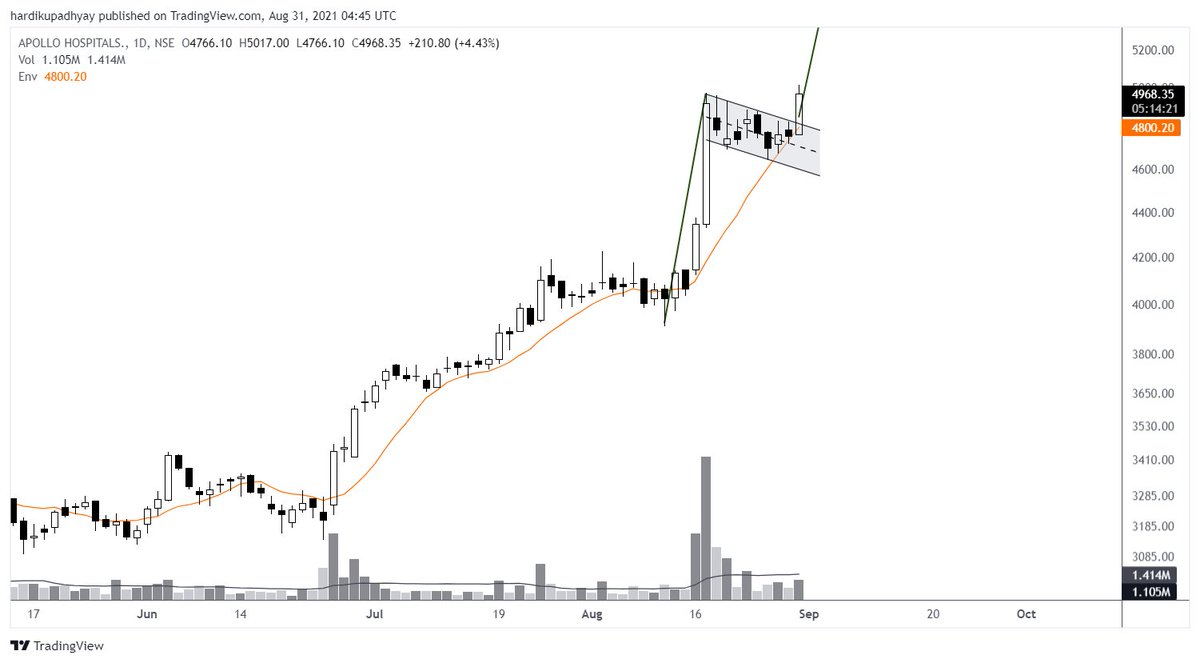
As per traditional chart analysis, the breakout from the flag can extend by a distance of the flagpole which gives us the price objective of 5850 or thereabouts.
Let's see what happens!
#ApolloHospital https://t.co/jHgjR2WThe
Looks like a Flag to me...
— Hardik Upadhyay, CMT. (@tradingwithdyr) August 30, 2021
A flag pattern is a continuation pattern that suggests a short-term consolidation in opposite direction preceding a strong move.
A breakout above 4850 could have a rapid movement!#ApolloHospitals pic.twitter.com/q7g4enQjRY