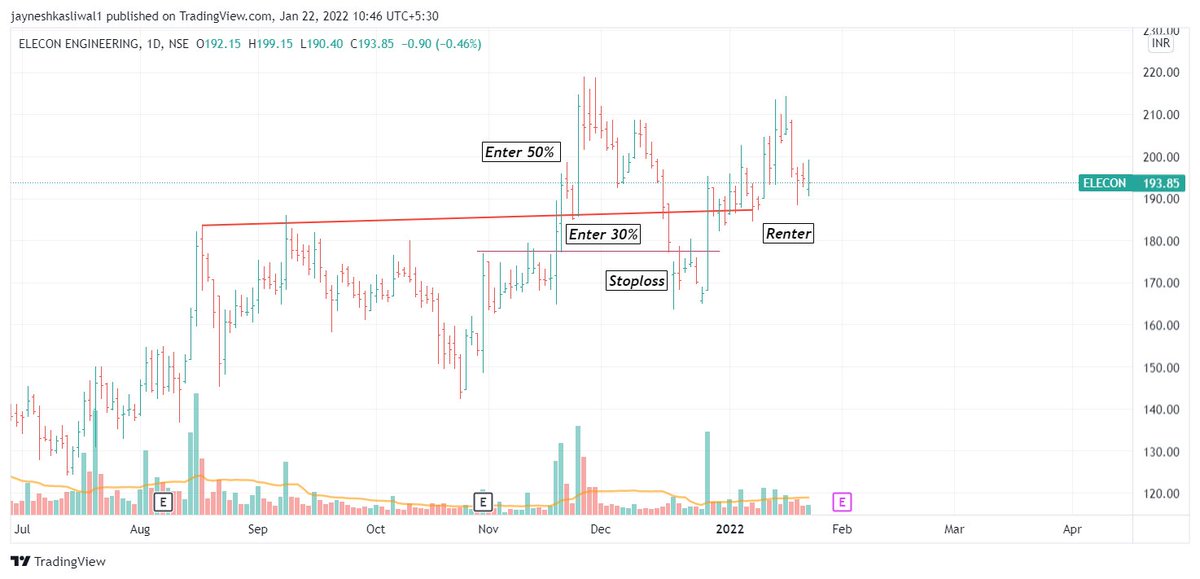
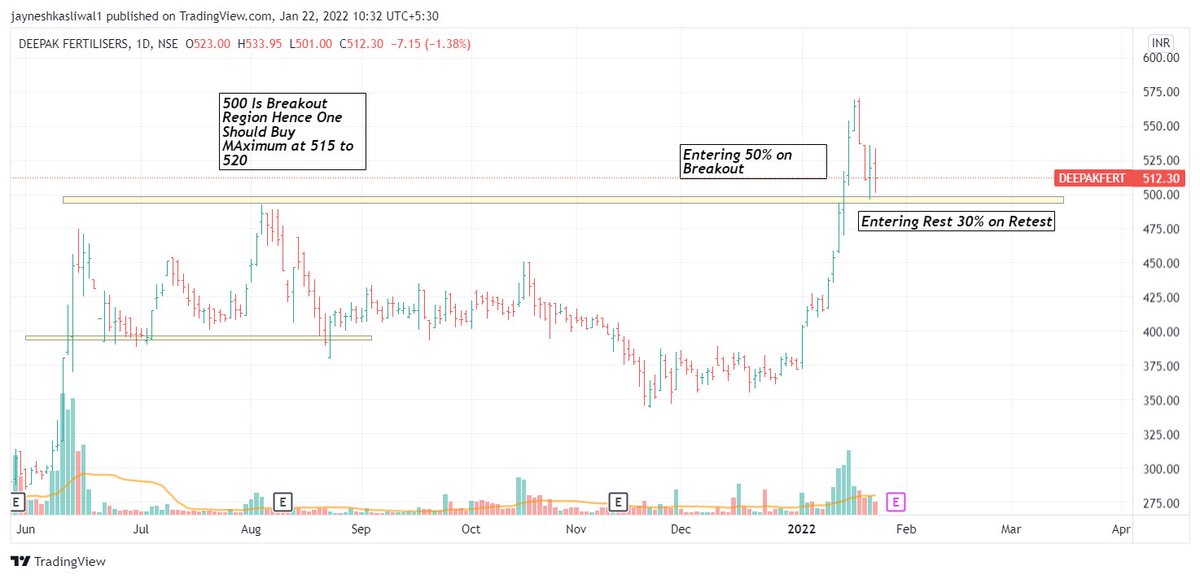
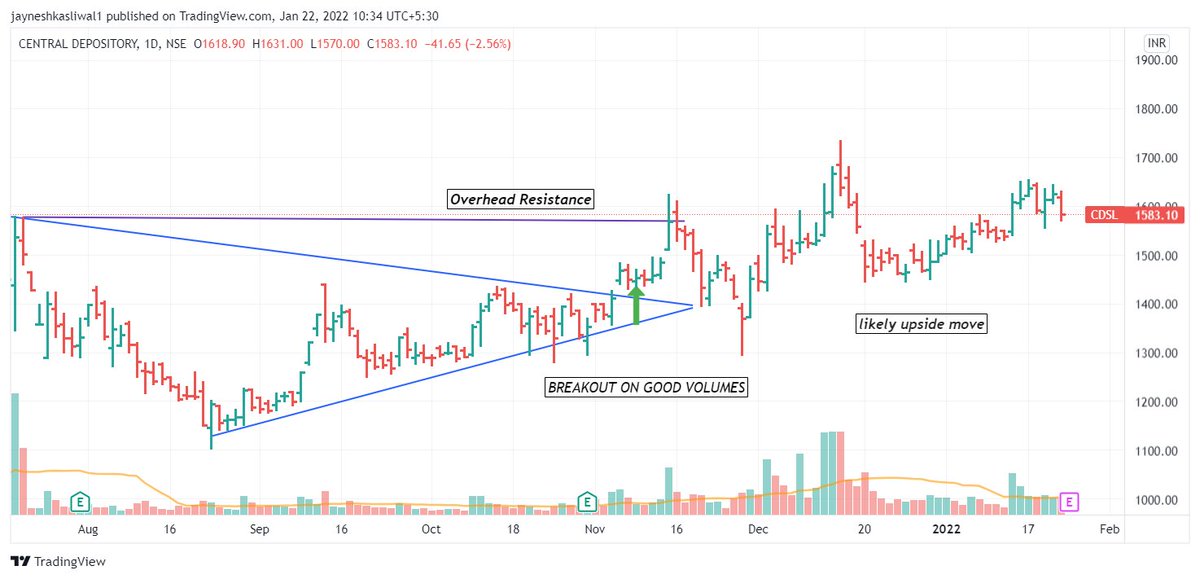
A breakout is a stock price moving outside a defined support or resistance level with increased volume.
Always trade breakouts in uptrend for high win ratios
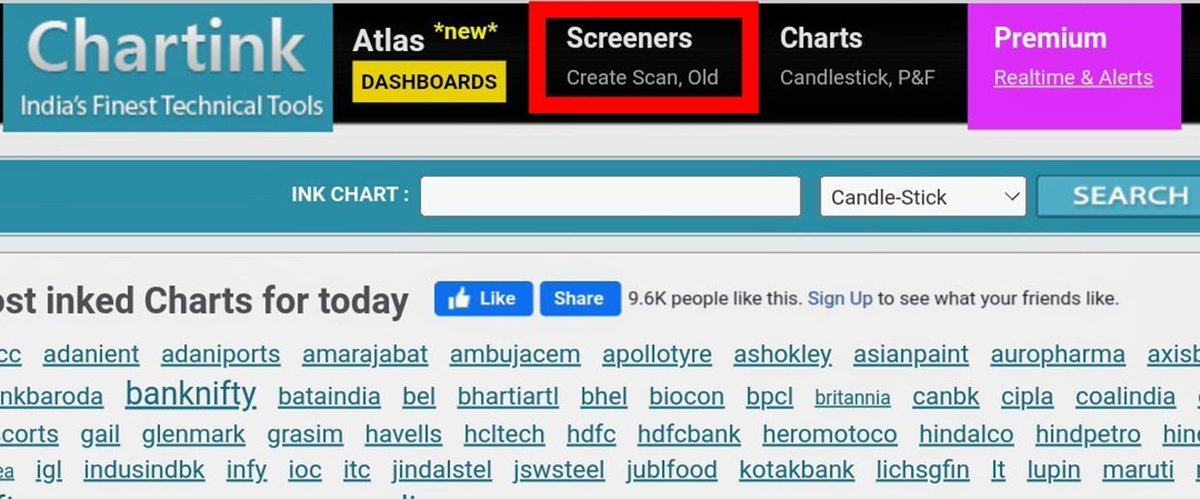
Source : Google
1/n


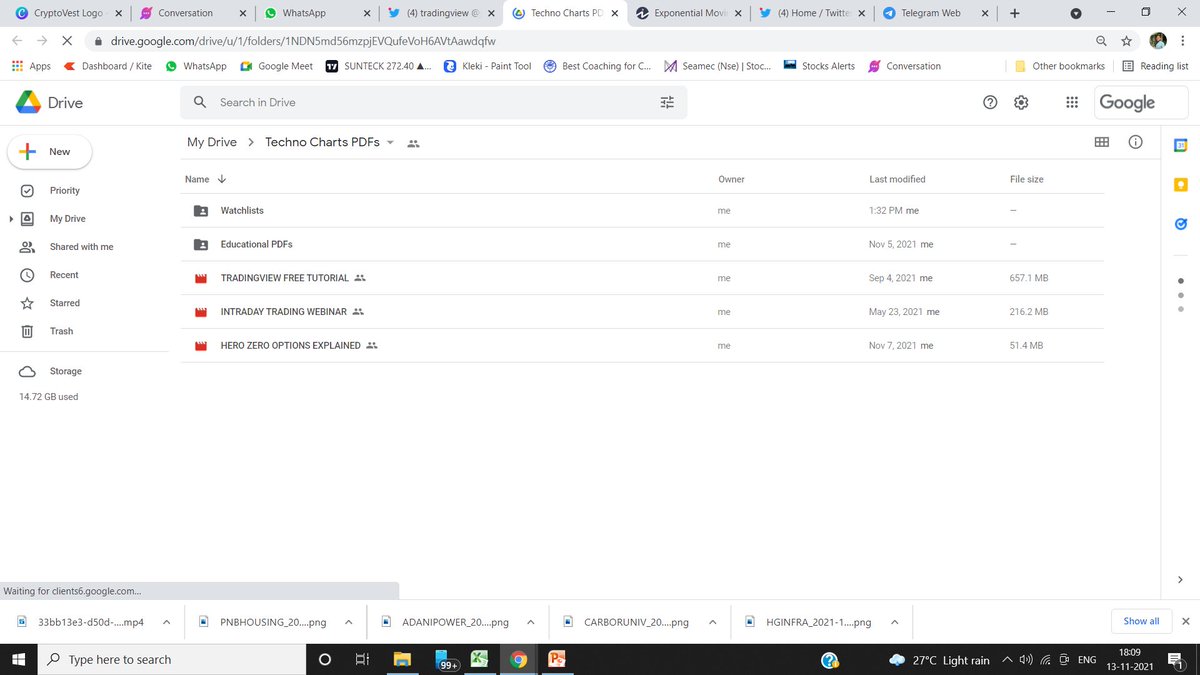
Drive Link for
— JayneshKasliwal (@JayneshKasliwal) November 5, 2021
Custom Made Pdfs on
1. Trading Strategies
2. Stock Selection
3. Tradingview Free Tutorial
4. Psychology https://t.co/9ukwfjLDYT
Retweet Share !@kuttrapali26 @MarketScientist @AmitabhJha3