SAnngeri Categories Screeners
7 days
30 days
All time
Recent
Popular


Isn't that amazing ??
And, you still want to search for something better..
Do not fear few whipsaws that happen now & then.
This "SAR" captures all the large moves 💯of the time.
Simple things are beautiful.
BUT you're adamant to make it complicated🤔😏
And, you still want to search for something better..
Do not fear few whipsaws that happen now & then.
This "SAR" captures all the large moves 💯of the time.
Simple things are beautiful.
BUT you're adamant to make it complicated🤔😏
This is the daily update and attached is the trade sheet from 1st Dec till date. Total profit is 3922 Points per Nifty lot by simply following price. https://t.co/8ZCC0nSWuW
— Harsh (@_Harsh_Mehta_) February 17, 2022


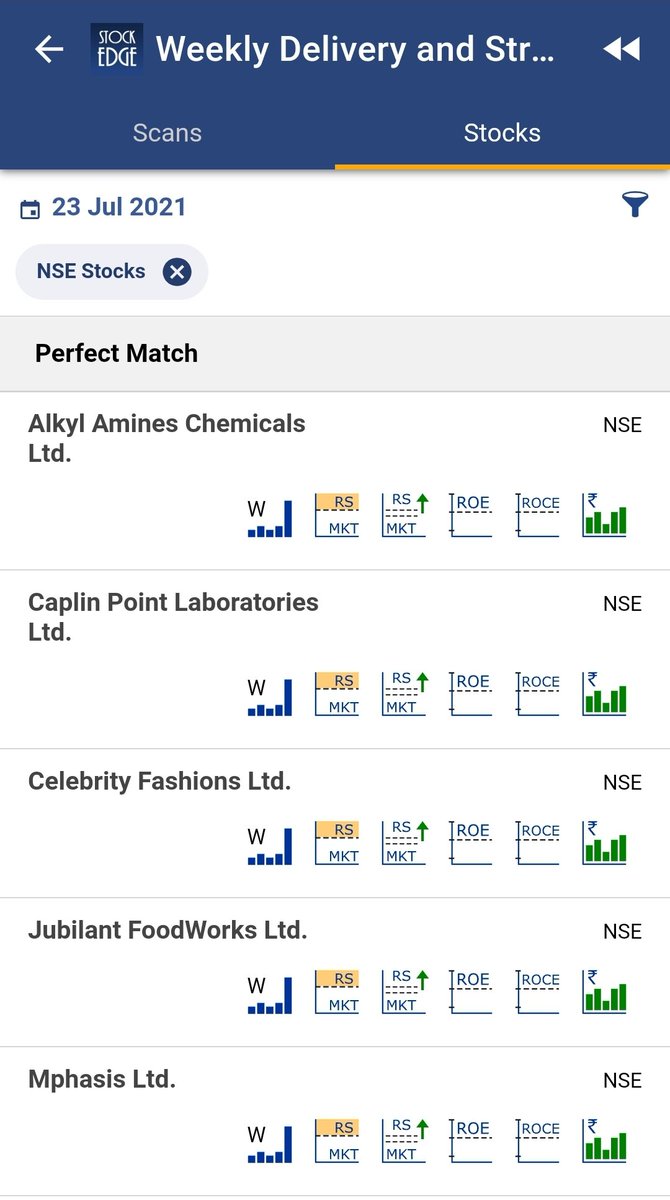
Parameters
1.Price structure - higher swing highs & swing lows
2. Momentum - doubled in last 250 days & trade close to recent highs
3. Demand - Higher volume on green bars
4. Volatility - Bigger bars on upside & shorter on downside
5. Relative strength - Outperforming market
1.Price structure - higher swing highs & swing lows
2. Momentum - doubled in last 250 days & trade close to recent highs
3. Demand - Higher volume on green bars
4. Volatility - Bigger bars on upside & shorter on downside
5. Relative strength - Outperforming market
Hello Aneesh, (1) apart from the volume supported HH-HL formation in ATH or 52 weeks high stocks, what other data point u see to shortlist scrip? (2) How do u estimate the holding period for the scrip? Plz guide
— Rohit Khanna\U0001f1ee\U0001f1f3 (@Rohit_MktWale) March 26, 2022


How to know bottom formed?
As per classical tech analysis
Whenever daily RSI starts trading above weekly RSI. Consider it as short term bottom
When weekly RSI, above monthly RSI midium term bottom
Now daily RSI 30
Weekly 37
Monthly 59
@bankniftydoctor ..RSI king.view pl
As per classical tech analysis
Whenever daily RSI starts trading above weekly RSI. Consider it as short term bottom
When weekly RSI, above monthly RSI midium term bottom
Now daily RSI 30
Weekly 37
Monthly 59
@bankniftydoctor ..RSI king.view pl
I will do either
— Discipline TrendFollower\U0001f600 (@SouravSenguptaI) March 7, 2022
1.Monthly RSI near 40 ( presently 58)..Did nearly 20 yr backtesting
Or
2 A close above 17350 ( monthly)..This will confirm HH Structure
Levels r as of now