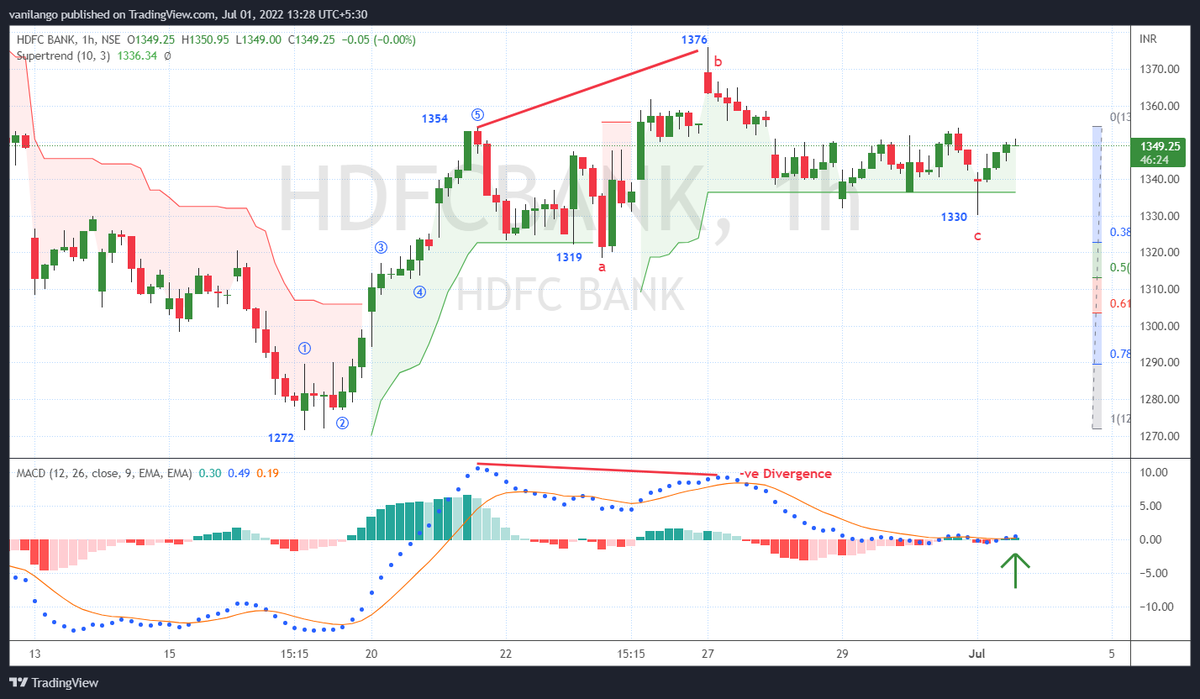
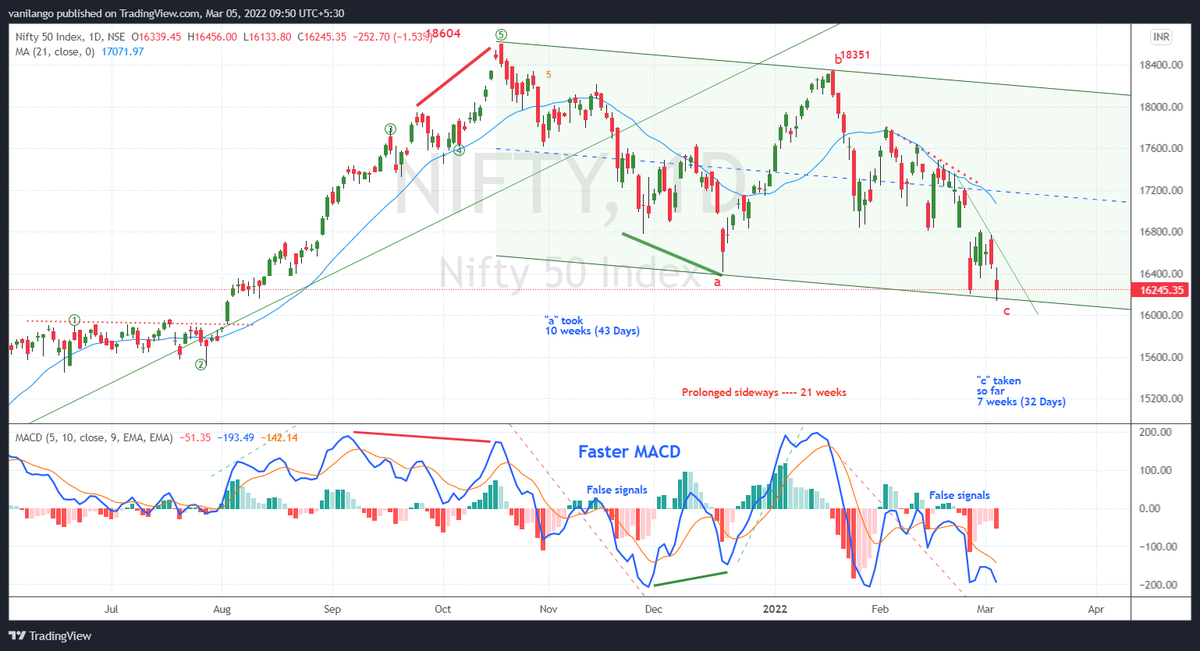
Macd measures the difference between two Exponential Moving Averages (EMAs).


master can you give few key points in english. Saw the entire video with subtitles but did not understand.
— bala (@BalaThink) March 13, 2022
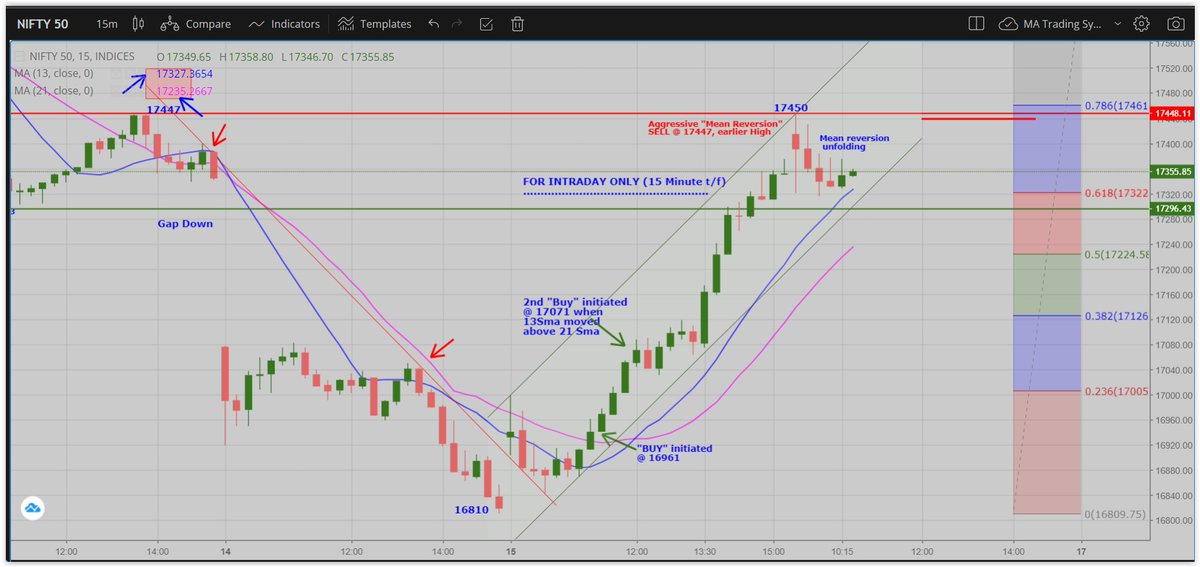
Is it better to buy when price below ema 21 ?\u2026 as SL will be less
— TaksJ (@TaksJoh) February 16, 2022
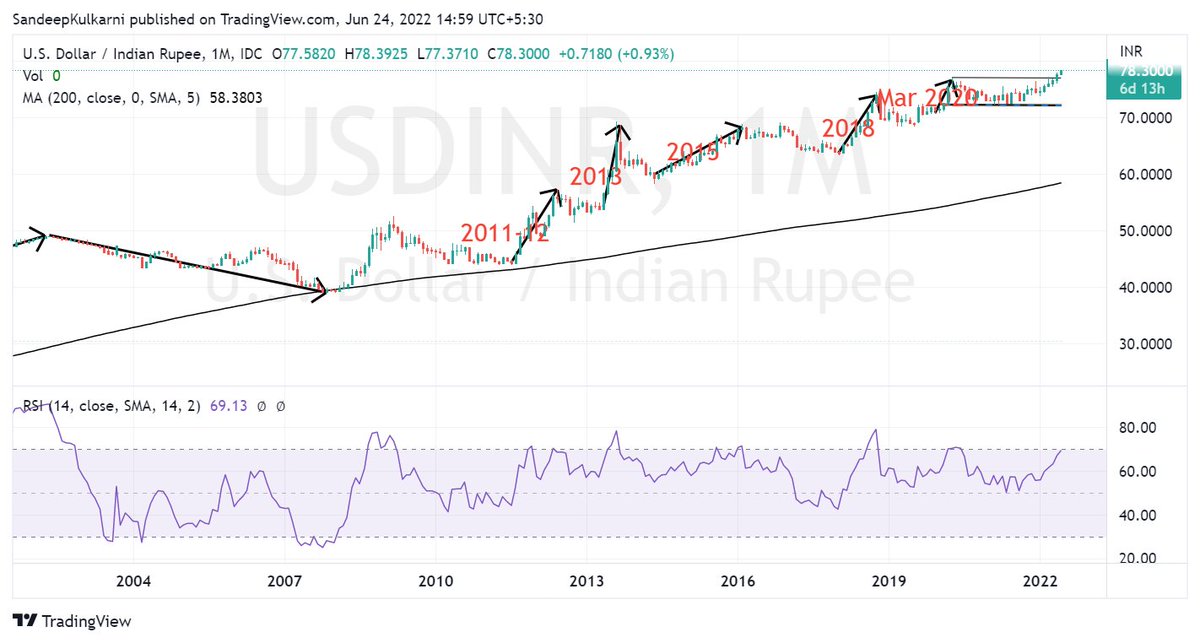
We know how our stock market has weathered the FII selling.
— Sandeep Kulkarni (@moneyworks4u_fa) June 10, 2022
But the equally big story is how Rupee has weathered $50bn+ outflows since Oct 2021. Hats off to RBI Governor Das & his team for having the vision of building huge reserves in his tenure. pic.twitter.com/CVuF9dM361
I am quite different from your style. I follow the market's volatility very closely. I have mock positions in 7-8 different strategies which allows me to stay connected. Whichever gives best profit is usually the one i trade in.
— Sarang Sood (@SarangSood) August 13, 2019
Anilji most of the time these days Theta only falls when market moves. So the Theta actually falls where market has moved to, not where our position was in the first place. By shifting we can come close to capturing the Theta fall but not always.
— Sarang Sood (@SarangSood) June 24, 2019
This week has been great so far. The main aim is to be in the right side of the volatility, rest the market will reward.
— Sarang Sood (@SarangSood) July 3, 2019
There is a difference between theta decay & fall in vega. Decay is certain but there is no guaranteed profit as delta moves can increase cost. Fall in vega on the other hand is backed by a powerful force that sells options and gives handsome returns. Our job is to identify them.
— Sarang Sood (@SarangSood) February 12, 2020