ChartIQ charts on Kite web just got an upgrade with custom timeframe charts, new indicators, backtesting from charts, and much more.
Here’s how you can switch to the new version of ChartIQ: https://t.co/rhXrQ330G7
A thread on all the new features 👇
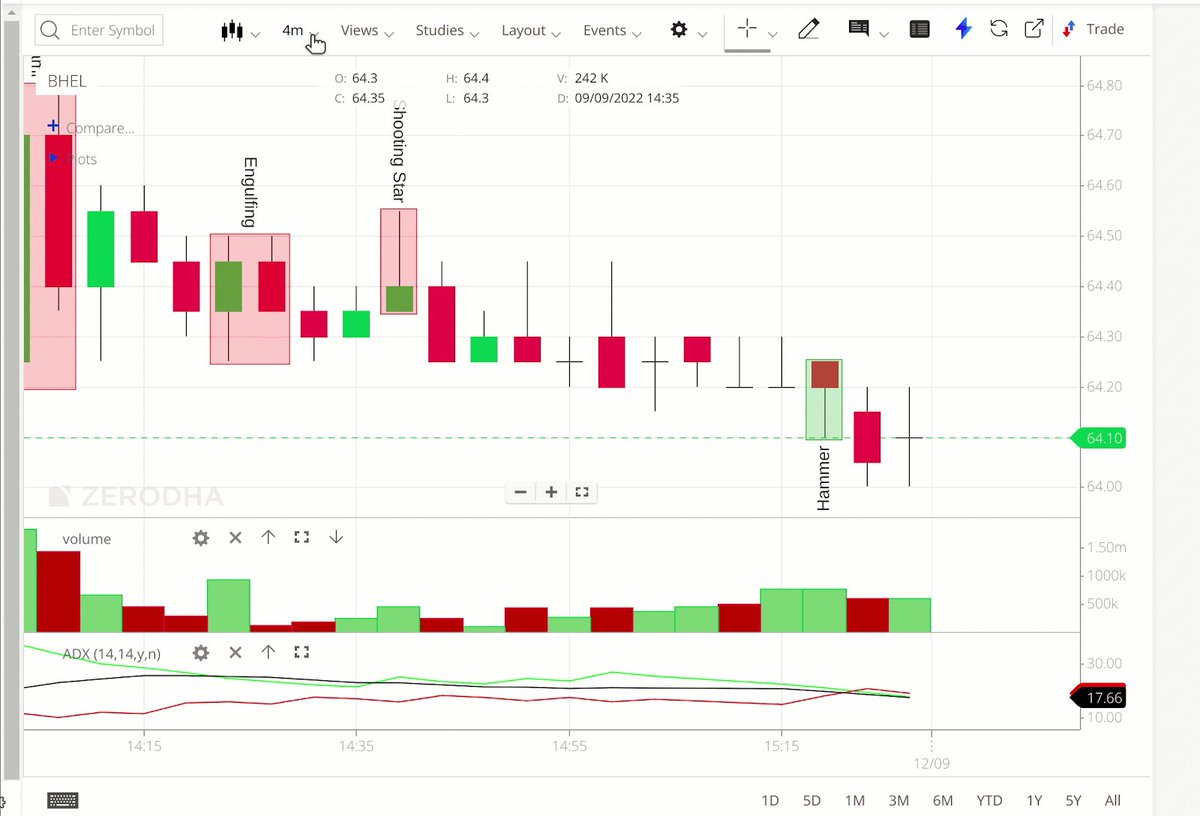
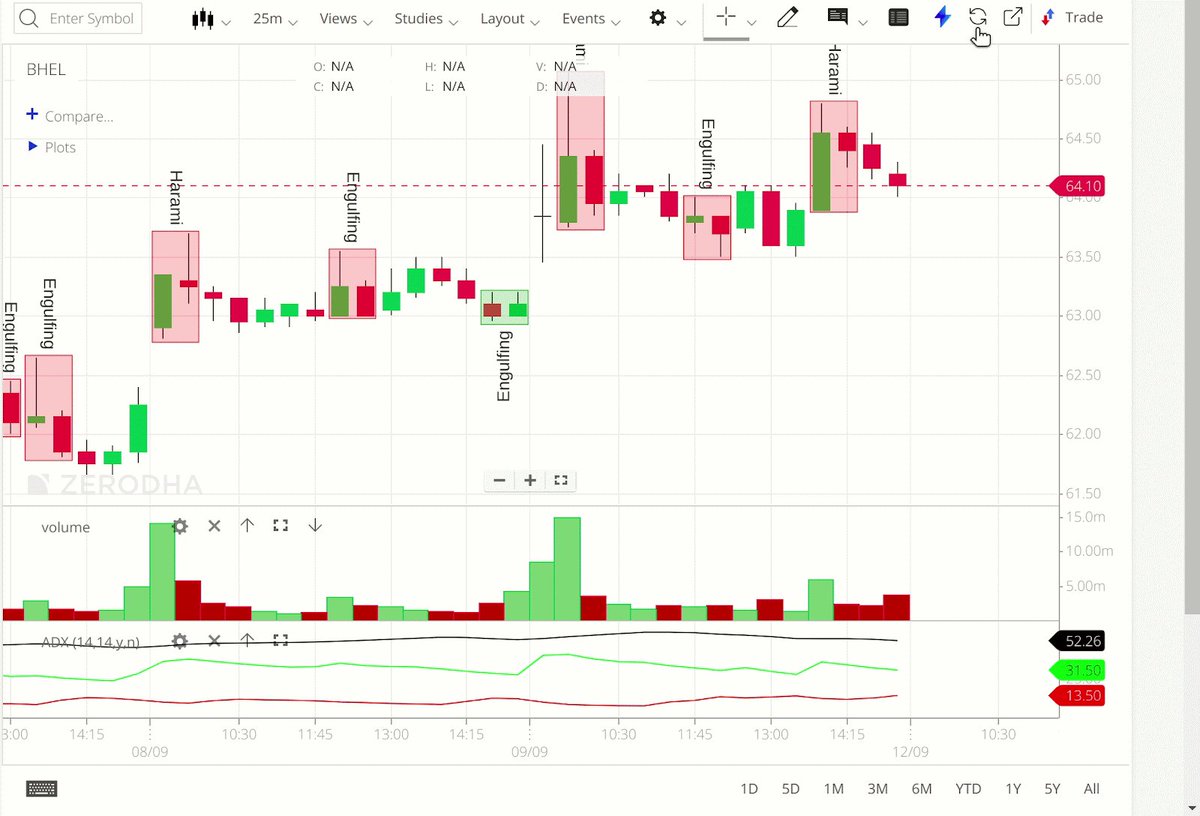
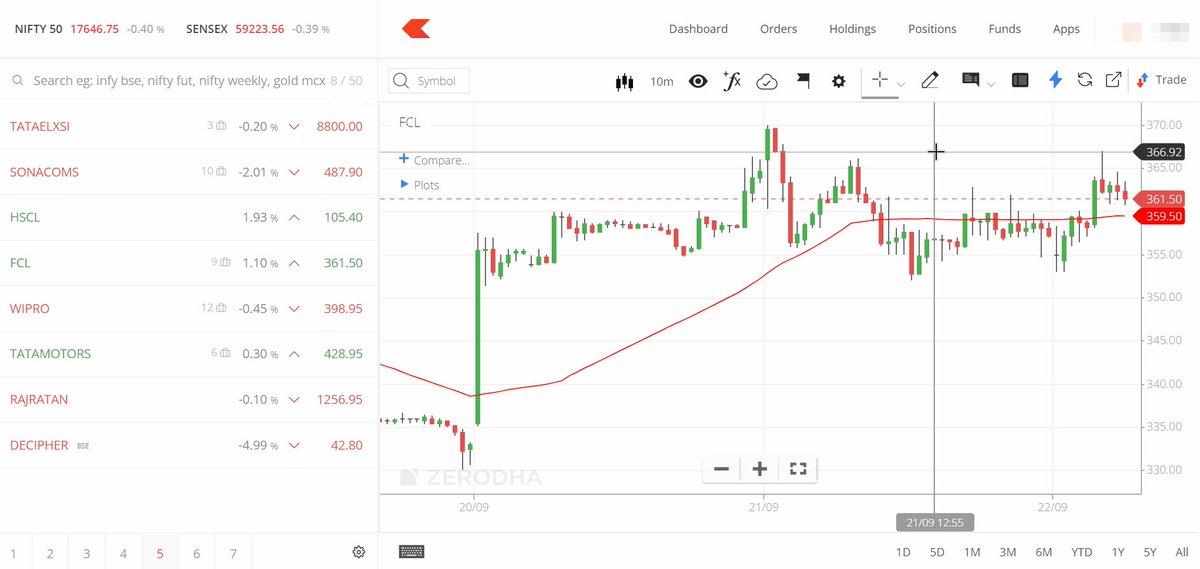
Custom timeframe charts
Charts with timeframes of 75 and 125 minutes were amongst the most popular feature requests. With the custom timeframe feature, you can now not only access 75 and 125-minute charts, but you can also do so for any timeframe of your choice.
Download historical data in CSV
You can now download chart data to Excel to run your own analyses.
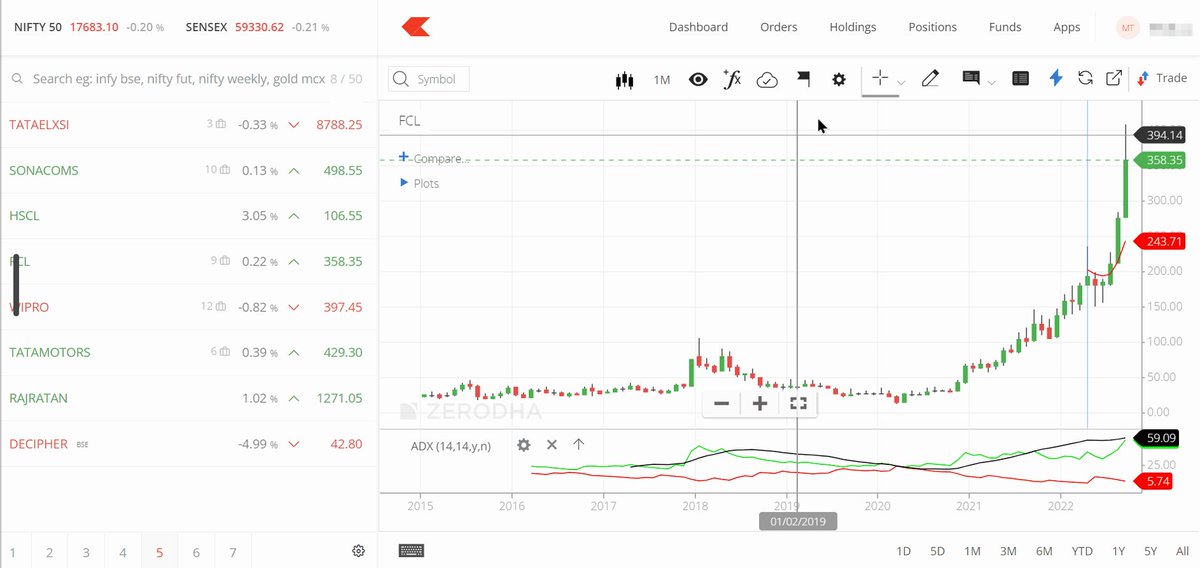
Backtesting from charts
@StreakTech allows you to create and backtest trading strategies without any coding. Streak is now integrated with Kite charts. Clicking on the Streak icon will start a backtest of widely used strategies with the indicators applied on the charts.
Shortcut keys for various functions
Chart shortcuts are now available on ChartIQ 8. Shortcuts can be used to quickly perform actions such as invoking the order window, accessing drawing tools, zooming, etc.