There are thousands of trading websites here are

Top 10 Websites that every trader should know๐Ÿงต

Retweet and Comment your Favourite Webistes !

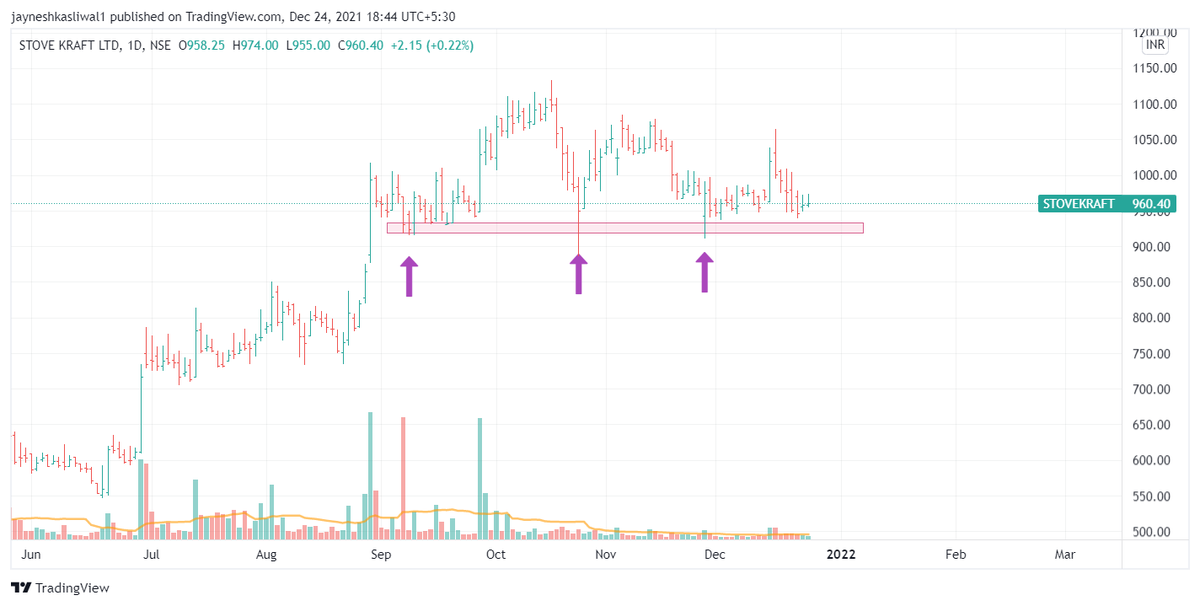
1. TradingView :

The best website for charting . Has numerous tools to organize your watchlists , add custom indicators , backtest Strategies , set alerts and use multiple charts in single screen .
The most popular websites in the world

@tradingview
https://t.co/jNJQI99v28
2. Market Pulse
Provides great interface on mobile app.
You can set alerts , make drawing on charts,add numerous indicators .
If you are a person who trades on mobile this is a go to app
https://t.co/mAkJsD6HbN
3. Stockedge
A great built in India app and one stop place for all data analytics . It has features like Market Breadth , Relative Strength , Fundamental scans , Technical scans , Insider deals and the stockedge community .
@mystockedge
https://t.co/Xfo6njhZbV
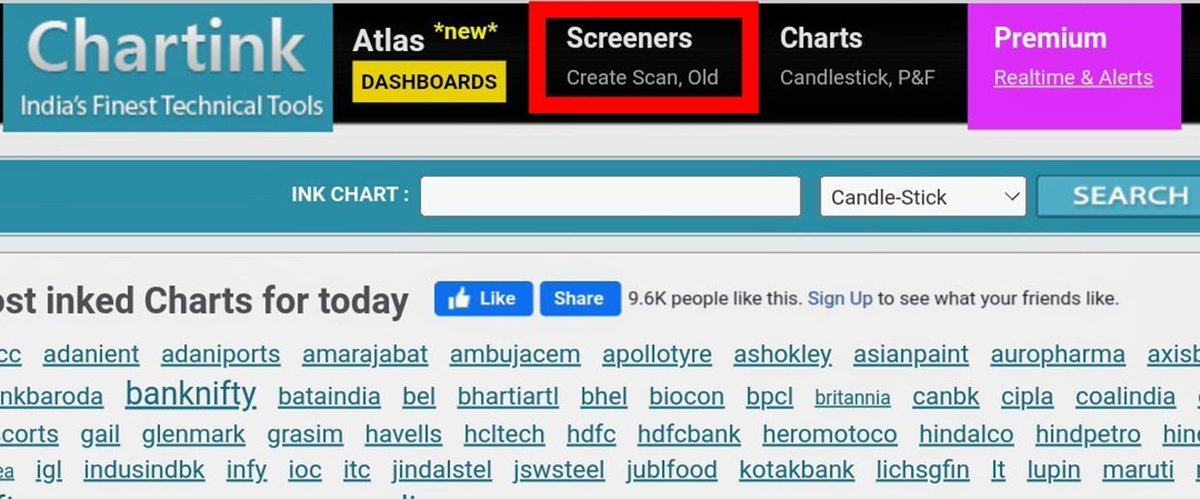
4. Chartink
The go to app for all types of technical scans .
It gives intraday alerts , gives eod analysis for free!

You can export your backtested results in excel , provides multi time frame scans and has the best feature of dashboard to add all scans
https://t.co/Z0C73cFTNe
5. Screener
Provides fundamental data for all stocks . You can even make fundamental scans to filter out stocks . Provides regular updates like news, annual reports , quarterly reports on the stocks you are interested in !
@screener_in
https://t.co/4WBBxKLUKZ
6. Ticker
" Investing ka Search Engine "
Provides analysis on different basket investments like banking, value stocks etc.
You can get curated news ,do peer comparision and advance scans
@finologyticker
https://t.co/re9xc2siOD
7. Opstra
One of the best websites for FnO traders
Provides OI data , Straddle and Strangle Premium Charts .
You can design combo strategies and check out their payout charts
It has Options Algorithms , OI dashboards , Put Call Oi dynamics
@Definedge
https://t.co/GPN9O997hN
8. My FnO
The most Advanced websites for FnO Traders which
provides heatmaps , advance declines , pcr , oi data analysis , sector analysis and futures analytics.

https://t.co/W50MKU05Or
9. StockMock
If you want to move to systematic form of trading and need backtesting software , this is a go to software where you can backtest time based straddles , strangles and many more .

It has limited features in free version
@stockmock_in
https://t.co/sw5N6bgMyz
10. Algotest
The Best website for free backtesting on all type of index options strategies .
You can export all trades in excel check out their co relations and have individual trade analysis like MDD , Avg Profit , Avg Loss , Max Loss etc
https://t.co/1BrbnIvCsi
I write Insightful tweets on trading and finance
Follow @JayneshKasliwal for regular updates !
https://t.co/frQPO2tsgU
Free Telegram Link
https://t.co/z988TyQcKm

Swing Trading Mentorship Details :
https://t.co/GLkbXReMif
https://t.co/9ukwfjLDYT

DRIVE LINK FOR
Pdf made by
@JayneshKasliwal

Open Folder: Educational Pdfs
Name : Complete Guide to Swing Trading

More than 15+ Pdfs shared

Retweet And Share
// End //

More from JayneshKasliwal

๐—›๐—ผ๐˜„ ๐˜๐—ผ ๐—ฐ๐—ฟ๐—ฒ๐—ฎ๐˜๐—ฒ ๐˜†๐—ผ๐˜‚๐—ฟ ๐—ผ๐˜„๐—ป ๐—–๐—ต๐—ฎ๐—ฟ๐˜๐—ถ๐—ป๐—ธ ๐—ฆ๐—ฐ๐—ฟ๐—ฒ๐—ฒ๐—ป๐—ฒ๐—ฟ

๐Ÿงต Thread ๐Ÿงต
[1/15]

๐—–๐—ต๐—ฎ๐—ฟ๐˜๐—ถ๐—ป๐—ธ ๐—ฆ๐—ฐ๐—ฟ๐—ฒ๐—ฒ๐—ป๐—ฒ๐—ฟ is a Stock screening tool that is useful to screen stocks based on Technical & Fundamentals.
๐Ÿ”ธ It scans stocks by using technical indicators like RSI, MACD, divergences, etc.
๐Ÿ”ธ It also uses fundamental tools like Book Value, EPS,PE etc
[2/15]

How To Create A Scan ?
Go to
https://t.co/JJEJBg3Cd8 & click on ๐˜Š๐˜ณ๐˜ฆ๐˜ข๐˜ต๐˜ฆ ๐˜š๐˜ค๐˜ข๐˜ฏ under ๐˜š๐˜ค๐˜ณ๐˜ฆ๐˜ฆ๐˜ฏ๐˜ฆ๐˜ณ๐˜ด.

[3/15]


๐—™๐—ถ๐—ฟ๐˜€๐˜ ๐—ฆ๐˜๐—ฒ๐—ฝ ๐—ง๐—ผ ๐—™๐—ถ๐—น๐˜๐—ฒ๐—ฟ ๐—ฆ๐˜๐—ผ๐—ฐ๐—ธ๐˜€
We can select segments of stocks of our choice, e.g. cash or futures stocks, Nifty 100 etc.
Click on green โ€˜+โ€™ icon to add conditions.
[4/15]


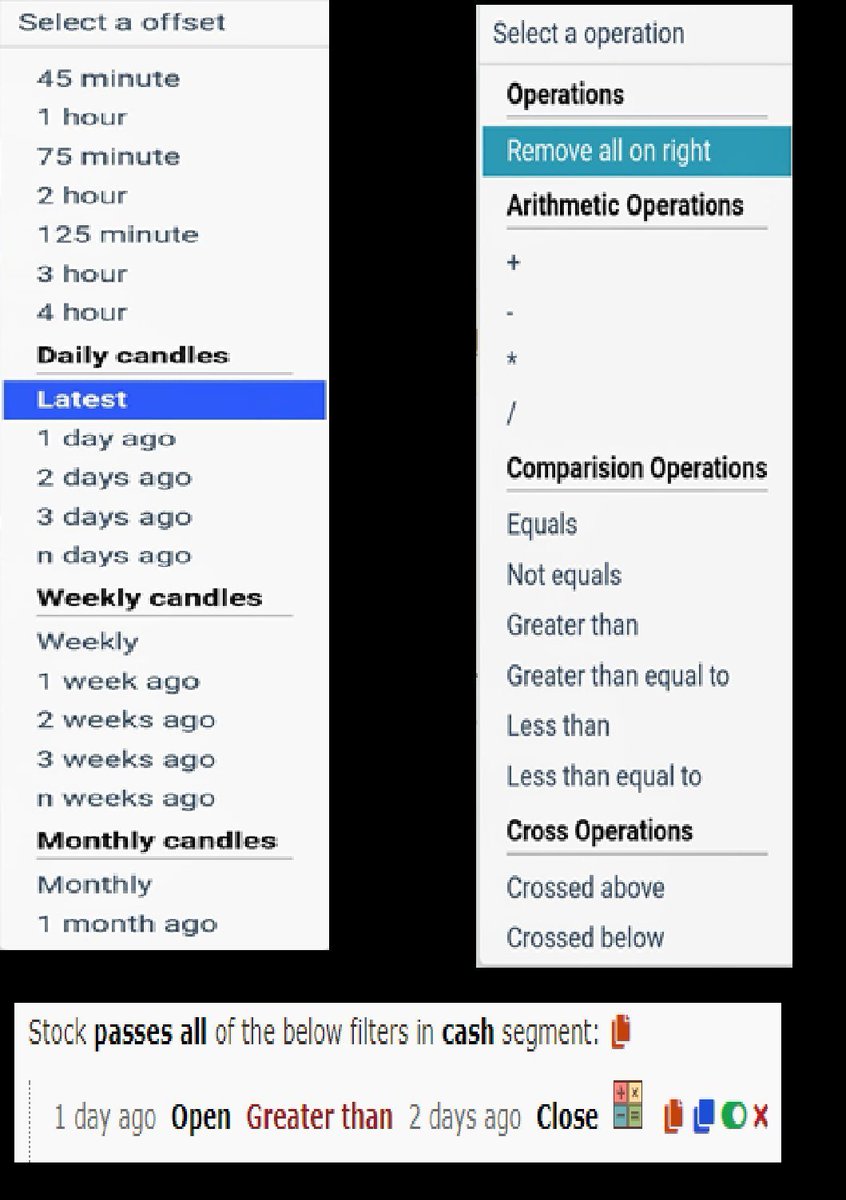
๐—–๐—ฎ๐—ป๐—ฑ๐—น๐—ฒ ๐—ง๐—ถ๐—บ๐—ฒ๐—ณ๐—ฟ๐—ฎ๐—บ๐—ฒ๐˜€ & ๐—–๐—ผ๐—บ๐—ฝ๐—ฎ๐—ฟ๐—ถ๐˜€๐—ผ๐—ป ๐—ข๐—ฝ๐—ฒ๐—ฟ๐—ฎ๐˜๐—ผ๐—ฟ๐˜€๐Ÿ”ธ We can select any timeframe of candles in Chartink, from minutes to years.
๐Ÿ”ธ And compare two candles using comparison operators like ๐˜Œ๐˜ฒ๐˜ถ๐˜ข๐˜ญ ๐˜ต๐˜ฐ or ๐˜Ž๐˜ณ๐˜ฆ๐˜ข๐˜ต๐˜ฆ๐˜ณ ๐˜›๐˜ฉ๐˜ข๐˜ฏ , crossovers etc
[5/15]
๐—ก๐—ถ๐—ณ๐˜๐˜†-๐—•๐—ฎ๐—ป๐—ธ๐—ป๐—ถ๐—ณ๐˜๐˜† ๐—ข๐—ฝ๐˜๐—ถ๐—ผ๐—ป ๐—•๐˜‚๐˜†๐—ถ๐—ป๐—ด ๐—ฆ๐˜๐—ฟ๐—ฎ๐˜๐—ฒ๐—ด๐˜†

Complete Backtest and Indicator link

๐Ÿงต A Thread ๐Ÿงต

๐—ฆ๐—ฒ๐˜๐˜‚๐—ฝ:
๐Ÿ”ธ Monthly Option Buying
๐Ÿ”ธ 50 ema on 3 min timeframe
๐Ÿ”ธ Supertrend 10 , 3
๐Ÿ”ธ Chart : Banknifty , Nifty Futures as we backtested on futures
๐Ÿ”ธ Entry 9:20 to 3:00
๐Ÿ”ธ Max 3 Entries per day
๐Ÿ”ธ Premium nearest to 200 Rs only

[2/18]

Why Monthly Option buying ?
๐Ÿ”ธ Less theta decay compared to weekly options
๐Ÿ”ธ Less Volatility
๐Ÿ”ธ Supertrend and MA Settings
[3/18]


๐Ÿ”ธ Indicator Link
๐Ÿ”ธ Click on the below ๐˜ญ๐˜ช๐˜ฏ๐˜ฌ -> ๐˜ˆ๐˜ฅ๐˜ฅ ๐˜ต๐˜ฐ ๐˜๐˜ข๐˜ท๐˜ฐ๐˜ถ๐˜ณ๐˜ช๐˜ต๐˜ฆ๐˜ด -> ๐˜ˆ๐˜ฅ๐˜ฅ ๐˜ฐ๐˜ฏ ๐˜Š๐˜ฉ๐˜ข๐˜ณ๐˜ต from favourites and start using it !

๐Ÿ”ธ
https://t.co/zVXavqLBto
[4/18]

๐—œ๐—ป๐—ฑ๐—ถ๐—ฐ๐—ฎ๐˜๐—ผ๐—ฟ ๐—ฆ๐—ฒ๐˜๐˜๐—ถ๐—ป๐—ด๐˜€ :
๐Ÿ”ธ Max 6 Trades per day ( Both CE and PE buy)
๐Ÿ”ธ Timings 9:20 am to 3:00 pm
๐Ÿ”ธ Supertrend : 10,3
๐Ÿ”ธ Moving Average 50 ema
[5/18]
Detailed Study of Stocks that became 5X in past 2 Years
A Mega Thread๐Ÿงต

Concepts :
Relative Strength
Stage Analysis

Retweet and Comment If you want a PDF

We have Got around 86 Stocks that became 5X in 2 years
These Belonged to various sectors and Groups
Excel Link for List of Stocks
https://t.co/jESOUMlbpd
( As on 30th March 2022)

[1/n]


All stocks had few things in common :

Stocks doubled Before entering into Stage 2 Uptrend
52 week RS was positive in stage 2
90% stocks even gave all time high breakout after Stage 2
60 Stocks had market cap less than 1000 Cr

Examples : OLECTRA , PGEL
[2/n]


So What is Relative Strength ?

Relative strength is a strategy used in momentum investing and in identifying value stocks.

It focuses on investing in stocks or other investments that have performed well relative to the market as a whole or to a relevant benchmark.
[3/n]

How to Apply ?
Type
โ€œRelative Strengthโ€
Choose any
By bharattrader
By traderlion
By Modhelius
I use by bharattrader
In setting use 52 period
Use Weekly Chart
4/n

You May Also Like