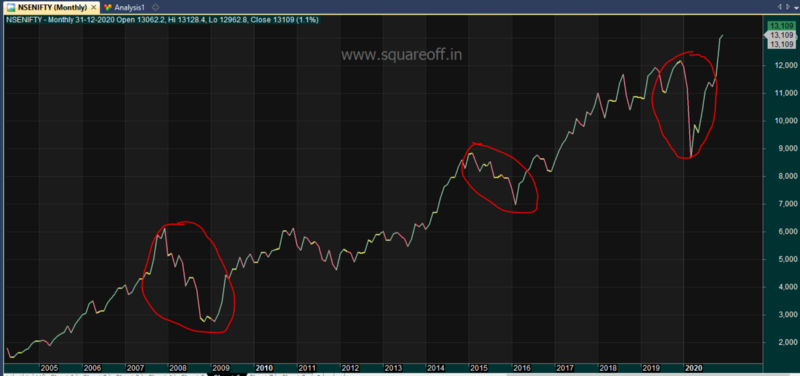
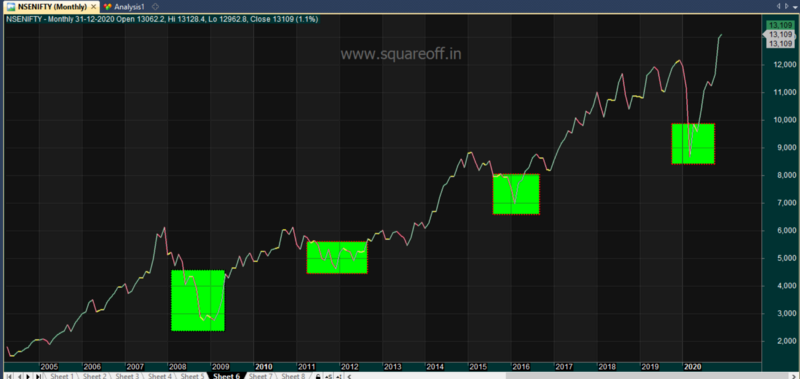
Analyzed last 12 years of historical data to check if there are any patterns we can observe to find the best time to invest in stocks for long term. #Nifty50 #investing #stocks 1/10

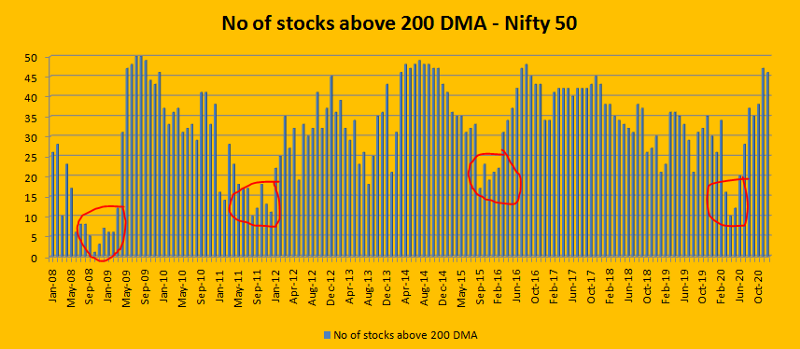
and in the year 2020, its less than 10 stocks, if you compare the above data with below Nifty chart, you can easily conclude that those extreme panic period were the times market bottomed out.
More from Kirubakaran Rajendran


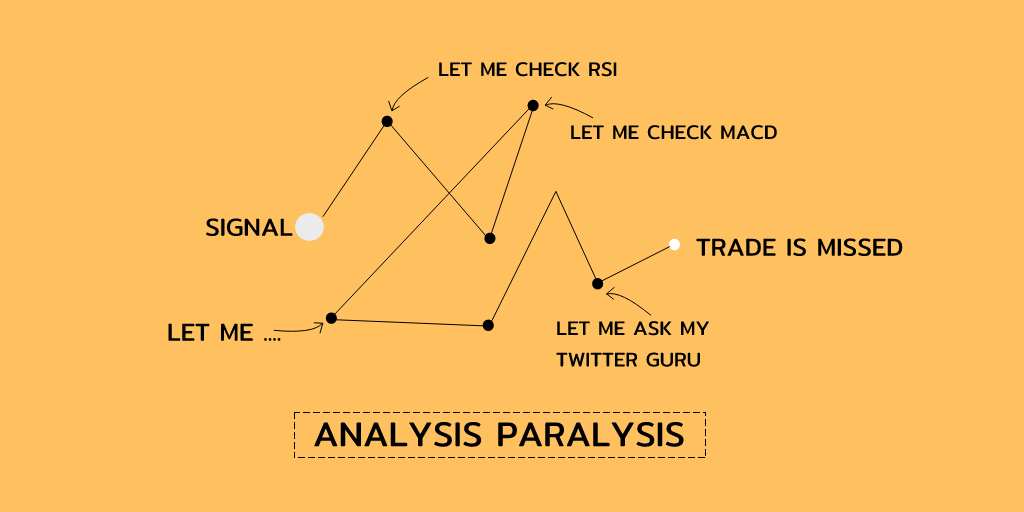
If you are someone who spends more time on analyzing markets during trading, then this for you. Certain traders will create their own bullish or bearish view in their mind but seek confirmation for their trades which is called as confirmation bias. #tradingpsychology 1/15
We do not like people or information that contradicts our thoughts. We like them when they confirm what we think. Hence, we tend to place more weight on information that confirms our trade position. Example- You think market is bullish & wanted to go on a long position,
Next a new bullish bar prints on the chart. You would think "Yes, my bullish proposition is still valid" (even though this bullish bar is smaller range)
A bearish bar prints. But you think "this bar lacks momentum" (because you already have firm belief that market is bullish)
One more bearish bar follows, pushing against a support level. But you would think "the support level is holding" Bullishness confirmed. Buy more! (even though this bar closed below the support level with clear momentum.)
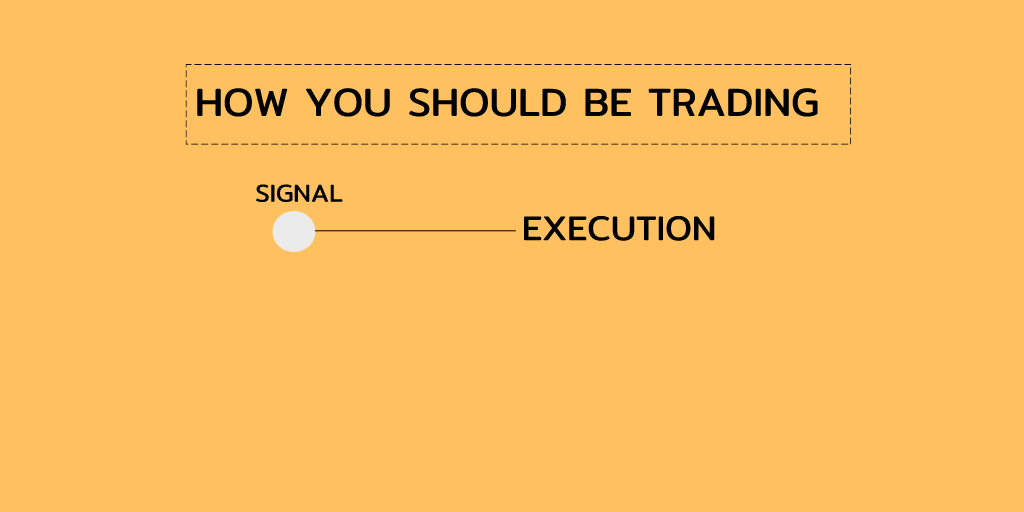
During Trading hours, Your maximum time is spent on? Are you spending more time on analyzing your trades before placing the order or after placing the order?
— Kirubakaran Rajendran (@kirubaakaran) December 14, 2020
We do not like people or information that contradicts our thoughts. We like them when they confirm what we think. Hence, we tend to place more weight on information that confirms our trade position. Example- You think market is bullish & wanted to go on a long position,
Next a new bullish bar prints on the chart. You would think "Yes, my bullish proposition is still valid" (even though this bullish bar is smaller range)
A bearish bar prints. But you think "this bar lacks momentum" (because you already have firm belief that market is bullish)
One more bearish bar follows, pushing against a support level. But you would think "the support level is holding" Bullishness confirmed. Buy more! (even though this bar closed below the support level with clear momentum.)

Most beginners when building a trading strategy simply use current info and test with it, they don't know How to Get Historical Stock Futures lot size, list of stocks that are part of index like Nifty 50, Nifty 500 historically, I will share all such info in this thread
Please note that there is no way to get the historical lot size of stocks futures, NSE don't publish it directly, so we need to do some calculated steps to get that data. Download Market Activity report https://t.co/HKLkSVtXEI
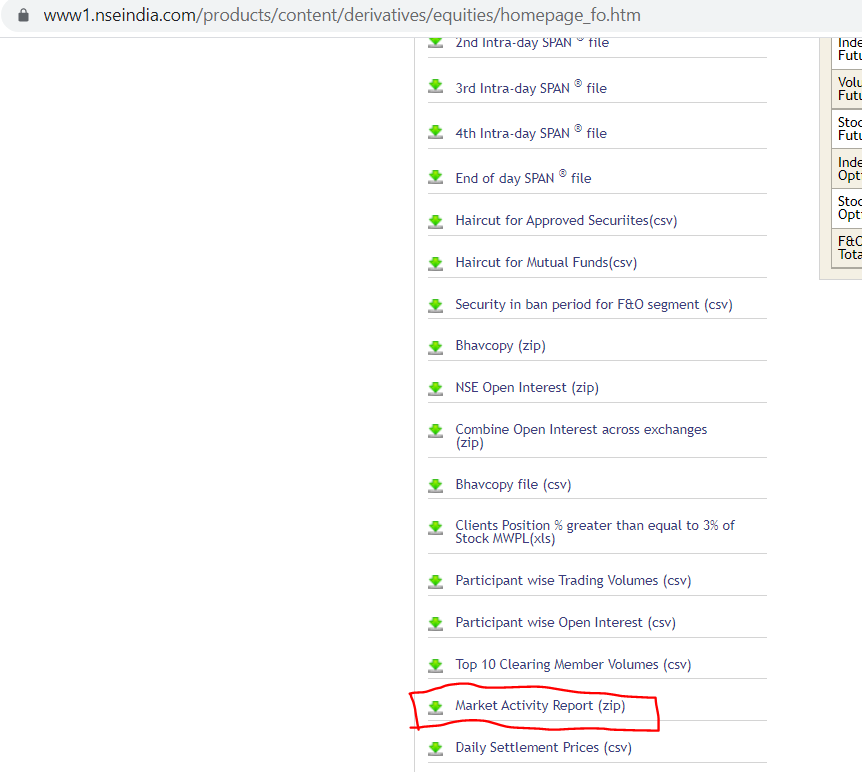
The zip file contains multiple files, open the second file.
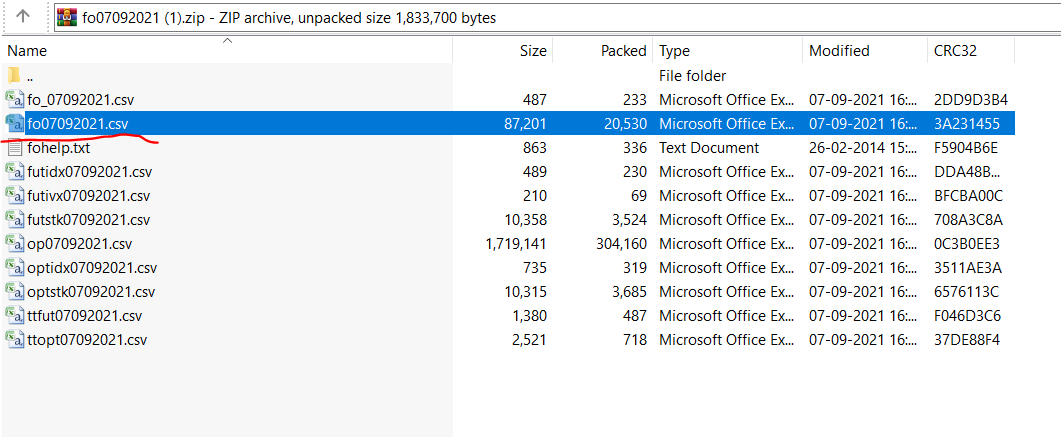
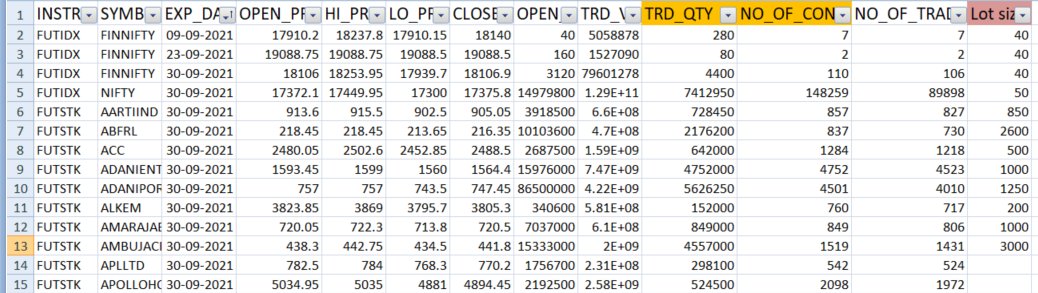
The file will contain stock symbol, expiry date, OHLC data, along with that you get traded quantity and No of contracts traded, using this data we can calculate the lot size of every stock symbol. Simply divide Traded QTY / NO of contracts gives you the lot size.
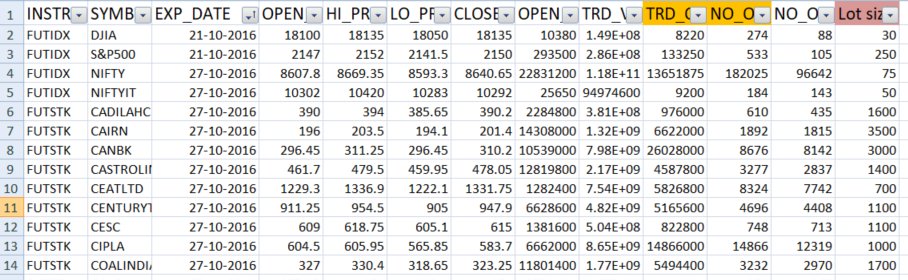
So to get the historical stock futures data, all you need to do is change the date in the below link
https://t.co/xIBXsPpIVt For an example, to get the historical stock futures lot size data for Sep 2016, use https://t.co/Criu7S3Fi5
Please note that there is no way to get the historical lot size of stocks futures, NSE don't publish it directly, so we need to do some calculated steps to get that data. Download Market Activity report https://t.co/HKLkSVtXEI
The zip file contains multiple files, open the second file.
The file will contain stock symbol, expiry date, OHLC data, along with that you get traded quantity and No of contracts traded, using this data we can calculate the lot size of every stock symbol. Simply divide Traded QTY / NO of contracts gives you the lot size.
So to get the historical stock futures data, all you need to do is change the date in the below link
https://t.co/xIBXsPpIVt For an example, to get the historical stock futures lot size data for Sep 2016, use https://t.co/Criu7S3Fi5


More from Trading

TradingView isn't just charts
It's much more powerful than you think
9 things TradingView can do, you'll wish you knew yesterday: 🧵
Collaborated with @niki_poojary
1/ Free Multi Timeframe Analysis
Step 1. Download Vivaldi Browser
Step 2. Login to trading view
Step 3. Open bank nifty chart in 4 separate windows
Step 4. Click on the first tab and shift + click by mouse on the last tab.
Step 5. Select "Tile all 4 tabs"
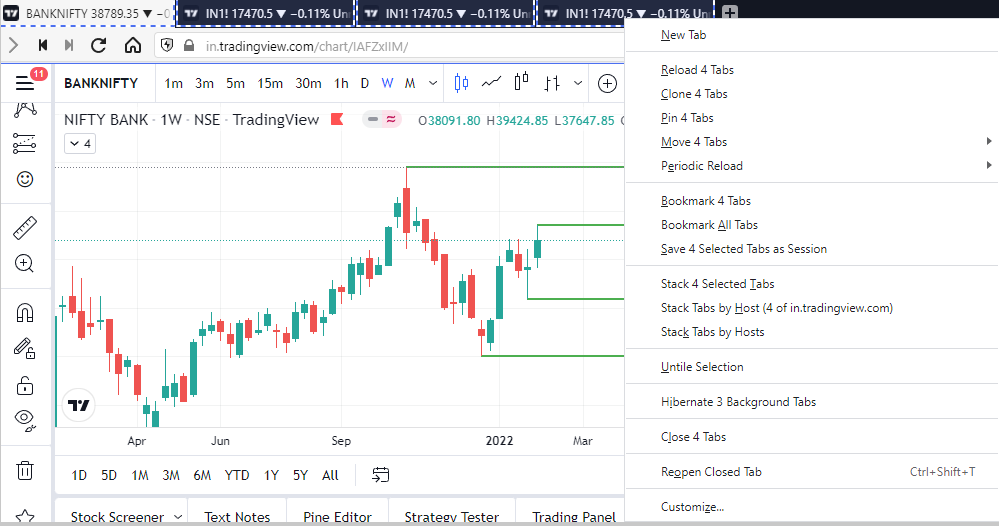
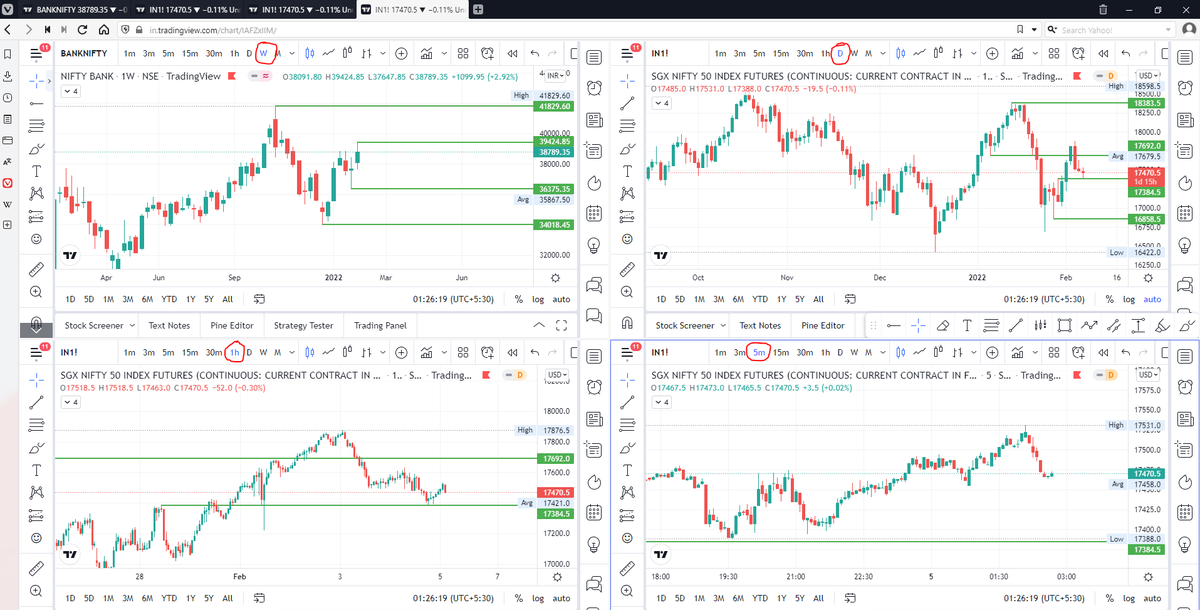
What happens is you get 4 charts joint on one screen.
Refer to the attached picture.
The best part about this is this is absolutely free to do.
Also, do note:
I do not have the paid version of trading view.
2/ Free Multiple Watchlists
Go through this informative thread where @sarosijghosh teaches you how to create multiple free watchlists in the free
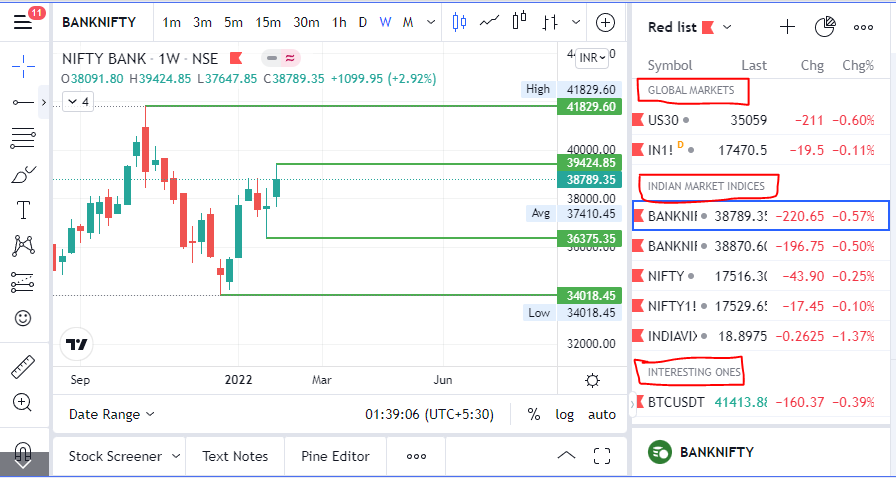
3/ Free Segregation into different headers/sectors
You can create multiple sections sector-wise for free.
1. Long tap on any index/stock and click on "Add section above."
2. Secgregate the stocks/indices based on where they belong.
Kinda like how I did in the picture below.
It's much more powerful than you think
9 things TradingView can do, you'll wish you knew yesterday: 🧵
Collaborated with @niki_poojary
1/ Free Multi Timeframe Analysis
Step 1. Download Vivaldi Browser
Step 2. Login to trading view
Step 3. Open bank nifty chart in 4 separate windows
Step 4. Click on the first tab and shift + click by mouse on the last tab.
Step 5. Select "Tile all 4 tabs"
What happens is you get 4 charts joint on one screen.
Refer to the attached picture.
The best part about this is this is absolutely free to do.
Also, do note:
I do not have the paid version of trading view.
2/ Free Multiple Watchlists
Go through this informative thread where @sarosijghosh teaches you how to create multiple free watchlists in the free
\U0001d5e0\U0001d602\U0001d5f9\U0001d601\U0001d5f6\U0001d5fd\U0001d5f9\U0001d5f2 \U0001d600\U0001d5f2\U0001d5f0\U0001d601\U0001d5fc\U0001d5ff \U0001d604\U0001d5ee\U0001d601\U0001d5f0\U0001d5f5\U0001d5f9\U0001d5f6\U0001d600\U0001d601 \U0001d5fc\U0001d5fb \U0001d5e7\U0001d5ff\U0001d5ee\U0001d5f1\U0001d5f6\U0001d5fb\U0001d5f4\U0001d603\U0001d5f6\U0001d5f2\U0001d604 \U0001d602\U0001d600\U0001d5f6\U0001d5fb\U0001d5f4 \U0001d601\U0001d5f5\U0001d5f2 \U0001d5d9\U0001d5e5\U0001d5d8\U0001d5d8 \U0001d603\U0001d5f2\U0001d5ff\U0001d600\U0001d5f6\U0001d5fc\U0001d5fb!
— Sarosij Ghosh (@sarosijghosh) September 18, 2021
A THREAD \U0001f9f5
Please Like and Re-Tweet. It took a lot of effort to put this together. #StockMarket #TradingView #trading #watchlist #Nifty500 #stockstowatch
3/ Free Segregation into different headers/sectors
You can create multiple sections sector-wise for free.
1. Long tap on any index/stock and click on "Add section above."
2. Secgregate the stocks/indices based on where they belong.
Kinda like how I did in the picture below.


You May Also Like


Took me 5 years to get the best Chartink scanners for Stock Market, but you’ll get it in 5 mminutes here ⏰
Do Share the above tweet 👆
These are going to be very simple yet effective pure price action based scanners, no fancy indicators nothing - hope you liked it.
https://t.co/JU0MJIbpRV
52 Week High
One of the classic scanners very you will get strong stocks to Bet on.
https://t.co/V69th0jwBr
Hourly Breakout
This scanner will give you short term bet breakouts like hourly or 2Hr breakout
Volume shocker
Volume spurt in a stock with massive X times