In this Video I have discussed about Mean Reversion Intraday Trading Strategy
More from JayneshKasliwal


Detailed Study of Stocks that became 5X in past 2 Years
A Mega Thread🧵
Concepts :
Relative Strength
Stage Analysis
Retweet and Comment If you want to attend a live session on the same !

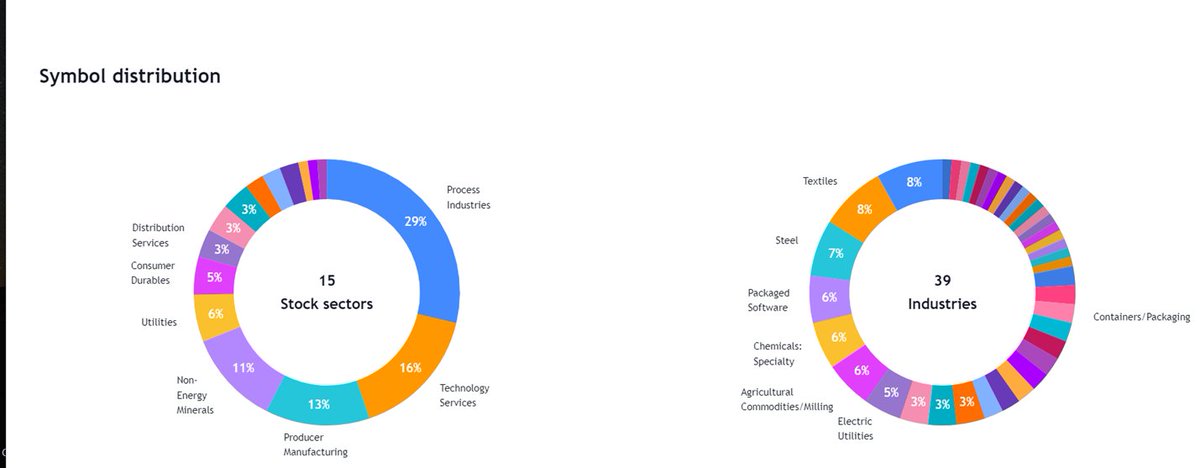
We have Got around 86 Stocks that became 5X in 2 years
These Belonged to various sectors and Groups
Excel Link for List of Stocks
https://t.co/jESOUM32b5
1/n
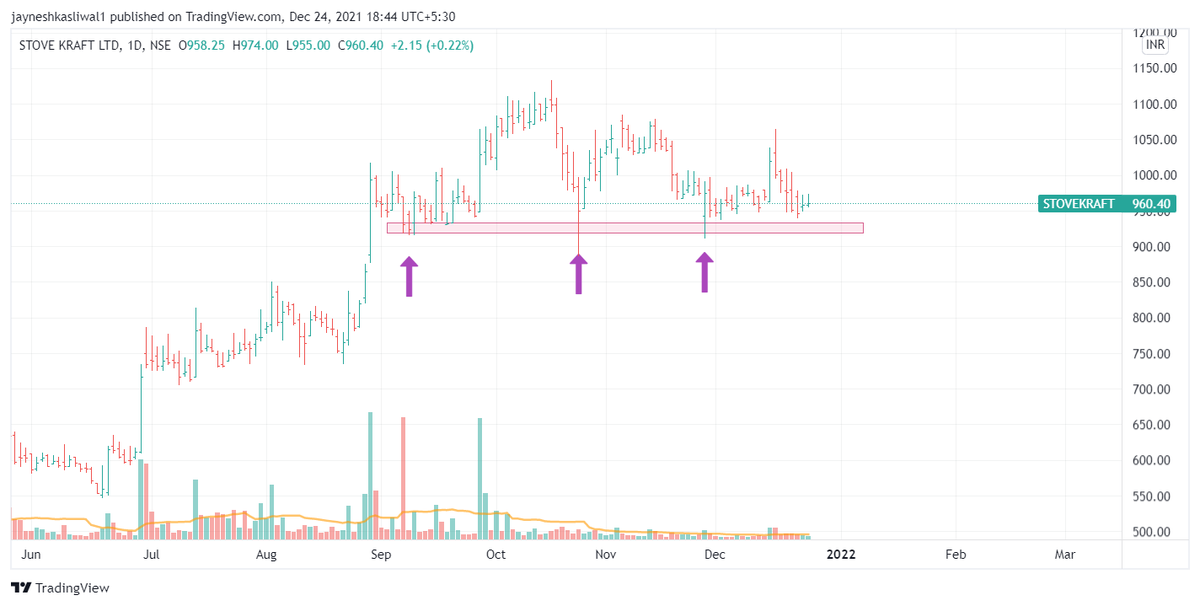
All stocks had few things in common :
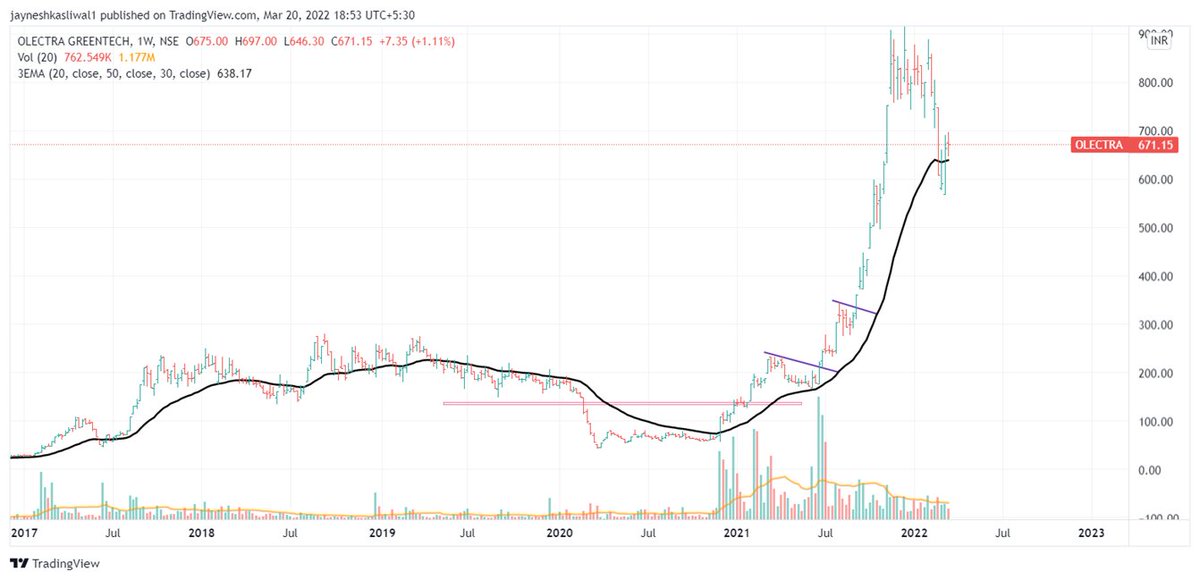
Stocks doubled Before entering into Stage 2 Uptrend
52 week RS was positive in stage 2
90% stocks even gave all time high breakout after Stage 2
60 Stocks had market cap less than 1000 Cr
Examples : OLECTRA , PGEL
2/n
So What is Relative Strength ?
Relative strength is a strategy used in momentum investing and in identifying value stocks.
It focuses on investing in stocks or other investments that have performed well relative to the market as a whole or to a relevant benchmark.
3/n
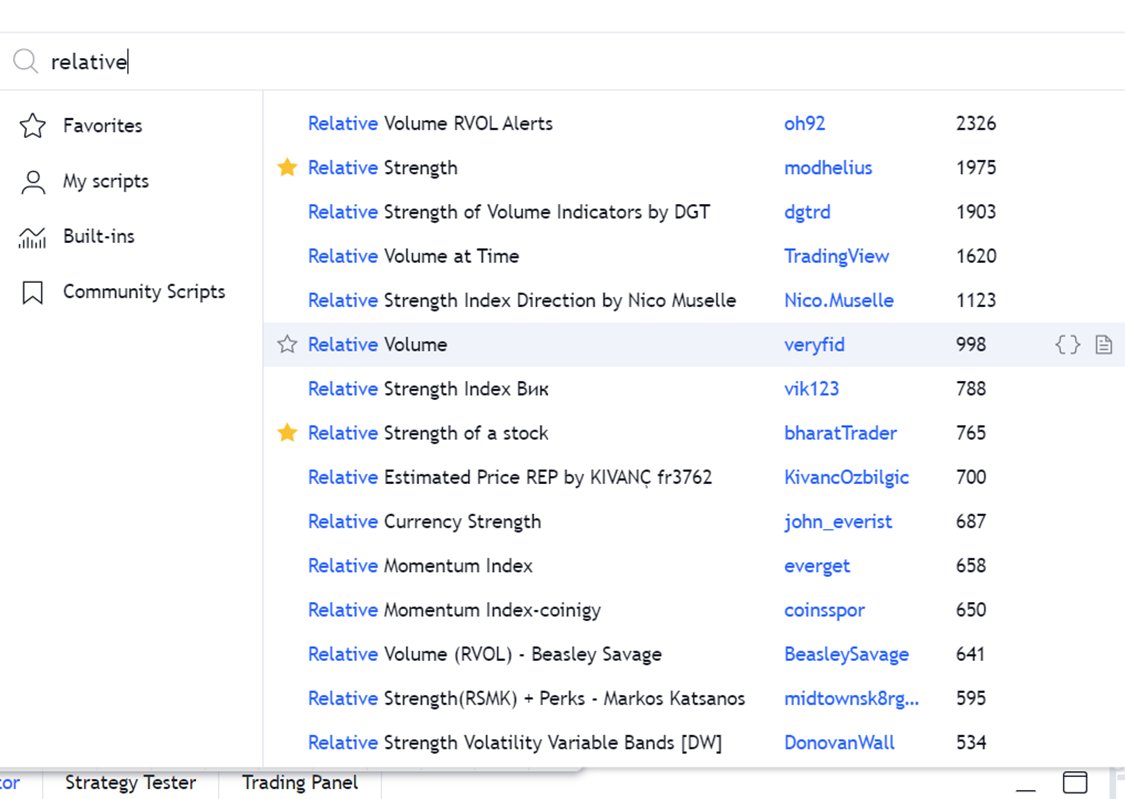
How to Apply ?
Type
“Relative Strength”
Choose any
By bharattrader
By traderlion
By Modhelius
I use by bharattrader
In setting use 52 period
Use Weekly Chart
4/n
A Mega Thread🧵
Concepts :
Relative Strength
Stage Analysis
Retweet and Comment If you want to attend a live session on the same !
We have Got around 86 Stocks that became 5X in 2 years
These Belonged to various sectors and Groups
Excel Link for List of Stocks
https://t.co/jESOUM32b5
1/n
All stocks had few things in common :
Stocks doubled Before entering into Stage 2 Uptrend
52 week RS was positive in stage 2
90% stocks even gave all time high breakout after Stage 2
60 Stocks had market cap less than 1000 Cr
Examples : OLECTRA , PGEL
2/n
So What is Relative Strength ?
Relative strength is a strategy used in momentum investing and in identifying value stocks.
It focuses on investing in stocks or other investments that have performed well relative to the market as a whole or to a relevant benchmark.
3/n
How to Apply ?
Type
“Relative Strength”
Choose any
By bharattrader
By traderlion
By Modhelius
I use by bharattrader
In setting use 52 period
Use Weekly Chart
4/n
Im sharing A stock Screener+Swing Strategy
Criteria
Screener to Find Swing Stocks.
1. 15% Range of Near 52 week high
2. Avg Volume > 1 lakh
3. Market Cap > 2000 Cr
4. Roe Roce > 20%
5. Eps Increasing Qtr on Qtr
6. Above 50 ema
1/
How to use This Screener
1. Basically we are screening Fundamentally strong stock
2. These are Technically Strong also as stocks are near 52 week high and above 50 ema
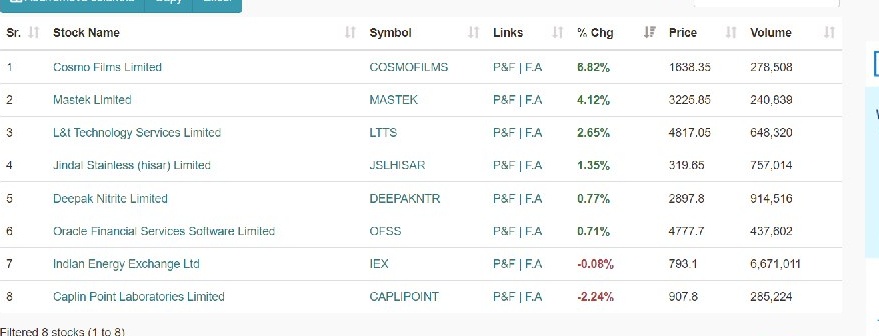
3. Below is the list For the screened Stocks.
4. Target should be on RR
@StocksNerd @MarketScientist
2/
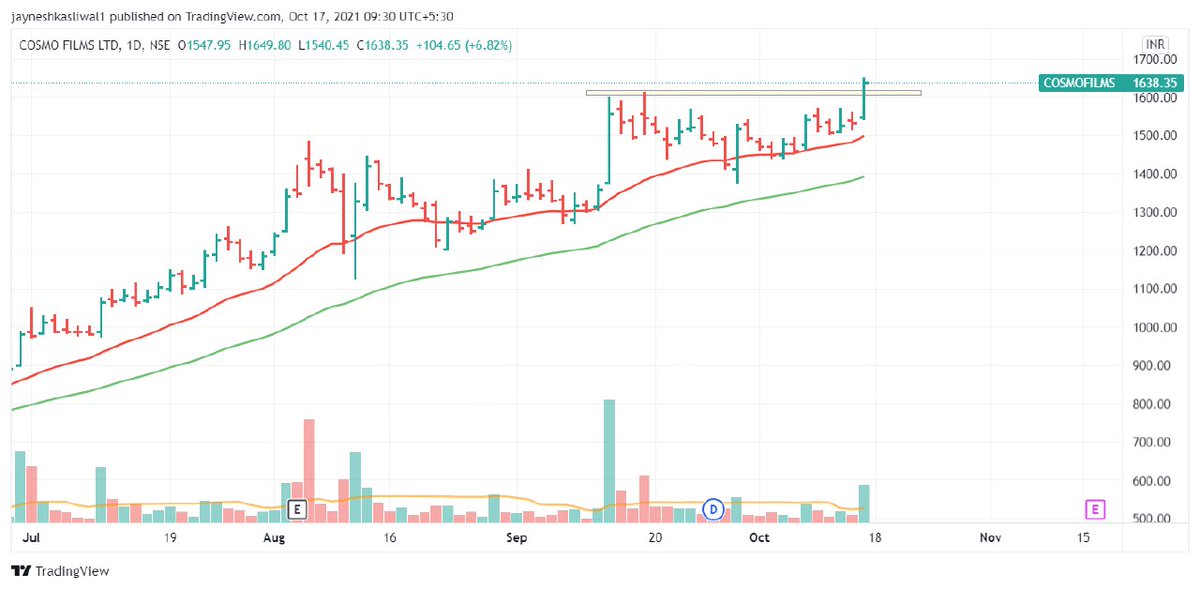
When to Enter
1. When 52 week High is Broken
2. Filter Stocks Select Stock With High Relative Strength
Example : #CosmoFilms , #Mastek
3. Keep Sl Below 21 ema
4. Keep Trailing Using 21 ema
5. Enter stocks on high volume breakout
6.Look for Price Range Contraction
3.
Your Most work is done by the screener
The most important task is filtering out manually and that's where your Returns will differ
As we are screening TechnoFunda stocks these can used for momentum investing
Join telegram https://t.co/b4N4oPAto9
@AmitabhJha3 @chartians
Criteria
Screener to Find Swing Stocks.
1. 15% Range of Near 52 week high
2. Avg Volume > 1 lakh
3. Market Cap > 2000 Cr
4. Roe Roce > 20%
5. Eps Increasing Qtr on Qtr
6. Above 50 ema
1/
How to use This Screener
1. Basically we are screening Fundamentally strong stock
2. These are Technically Strong also as stocks are near 52 week high and above 50 ema
3. Below is the list For the screened Stocks.
4. Target should be on RR
@StocksNerd @MarketScientist
2/
When to Enter
1. When 52 week High is Broken
2. Filter Stocks Select Stock With High Relative Strength
Example : #CosmoFilms , #Mastek
3. Keep Sl Below 21 ema
4. Keep Trailing Using 21 ema
5. Enter stocks on high volume breakout
6.Look for Price Range Contraction
3.
Your Most work is done by the screener
The most important task is filtering out manually and that's where your Returns will differ
As we are screening TechnoFunda stocks these can used for momentum investing
Join telegram https://t.co/b4N4oPAto9
@AmitabhJha3 @chartians

More from Trading strategies


Detailed Study of Stocks that became 5X in past 2 Years
A Mega Thread🧵
Concepts :
Relative Strength
Stage Analysis
Retweet and Comment If you want to attend a live session on the same !
We have Got around 86 Stocks that became 5X in 2 years
These Belonged to various sectors and Groups
Excel Link for List of Stocks
https://t.co/jESOUM32b5
1/n
All stocks had few things in common :
Stocks doubled Before entering into Stage 2 Uptrend
52 week RS was positive in stage 2
90% stocks even gave all time high breakout after Stage 2
60 Stocks had market cap less than 1000 Cr
Examples : OLECTRA , PGEL
2/n
So What is Relative Strength ?
Relative strength is a strategy used in momentum investing and in identifying value stocks.
It focuses on investing in stocks or other investments that have performed well relative to the market as a whole or to a relevant benchmark.
3/n
How to Apply ?
Type
“Relative Strength”
Choose any
By bharattrader
By traderlion
By Modhelius
I use by bharattrader
In setting use 52 period
Use Weekly Chart
4/n


You May Also Like

Department List of UCAS-China PROFESSORs for ANSO, CSC and UCAS (fully or partial) Scholarship Acceptance
1) UCAS School of physical sciences Professor
https://t.co/9X8OheIvRw
2) UCAS School of mathematical sciences Professor
3) UCAS School of nuclear sciences and technology
https://t.co/nQH8JnewcJ
4) UCAS School of astronomy and space sciences
https://t.co/7Ikc6CuKHZ
5) UCAS School of engineering
6) Geotechnical Engineering Teaching and Research Office
https://t.co/jBCJW7UKlQ
7) Multi-scale Mechanics Teaching and Research Section
https://t.co/eqfQnX1LEQ
😎 Microgravity Science Teaching and Research
9) High temperature gas dynamics teaching and research section
https://t.co/tVIdKgTPl3
10) Department of Biomechanics and Medical Engineering
https://t.co/ubW4xhZY2R
11) Ocean Engineering Teaching and Research
12) Department of Dynamics and Advanced Manufacturing
https://t.co/42BKXEugGv
13) Refrigeration and Cryogenic Engineering Teaching and Research Office
https://t.co/pZdUXFTvw3
14) Power Machinery and Engineering Teaching and Research