How to set Small Stop loss ??
Please👇
1️⃣ If we trade on Monthly chart - stop loss set on weekly lower low
2️⃣ If we trade on Weekly chart than SL on Daily LL
3️⃣ Daily chart - Hourly LL
4️⃣ Hourly chart - 15 minutes LL
5️⃣ 15 minutes chart - 5 minutes LL
More from jitu



More from Stoploss

I follow SL for my long term positions based on weekly previous swing lows. I am out if it gets hit.
So, I am least worried in these minor dips as manier times it will give you opportunity to add more of your favorite names.
So, I am least worried in these minor dips as manier times it will give you opportunity to add more of your favorite names.
LEARNING \u2b55\ufe0f\u2b55\ufe0f\u2b55\ufe0f
— The_Chartist \U0001f4c8 (@nison_steve) April 7, 2021
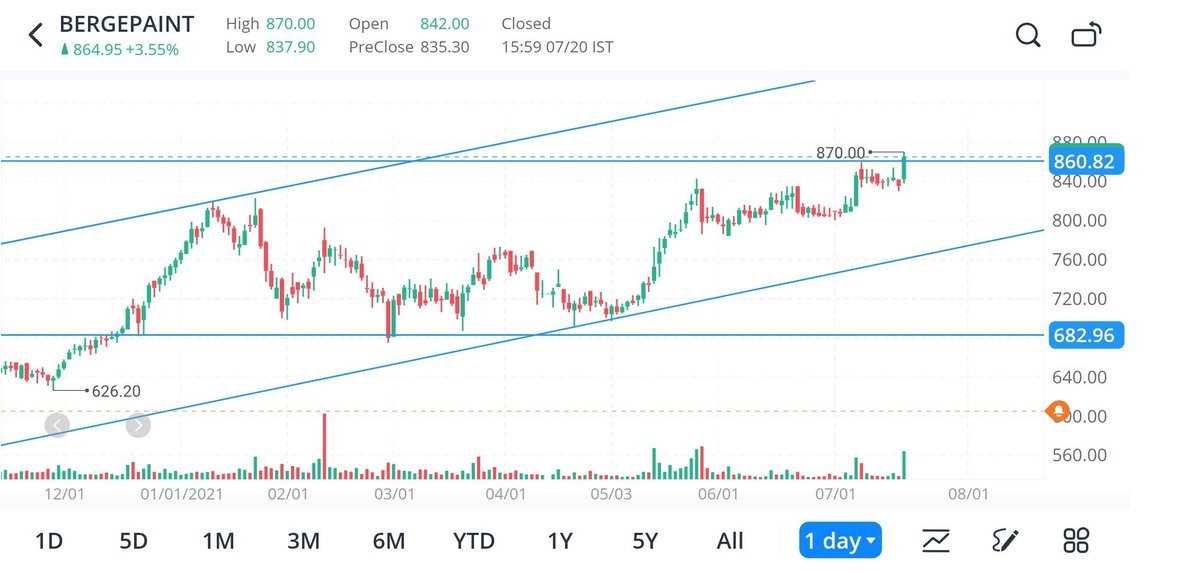
Balaji Amines -
An explanation of how trailing stop loss works. With every base formation, the stop loss level is moved up thereby locking profits. Stop-loss can be placed via GTT Orders.
Assumption - Trading on a weekly scale pic.twitter.com/hojzClLOhg


Retailers late sellers who place sl at visual reference levels are thrown out. Avoid placing sl at same location were retailers place stoploss https://t.co/qctgpFYLnK
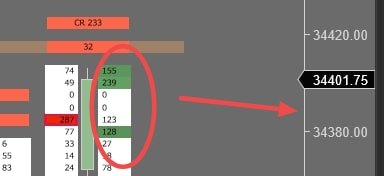
This is the reason for retailers stoploss. Check it out \U0001f447 https://t.co/fnHPgzCCVn pic.twitter.com/njvqgM9PI3
— Learn to Trade (@learntotrade365) July 28, 2021

The absolute best thread to read on trailing methods by @Traderknight007
Read and follow this.. he has aptly explained about various methods to trail.
Read and follow this.. he has aptly explained about various methods to trail.
2. TRAILING METHODS-
— Trader knight (@Traderknight007) December 24, 2020
1. SWING POINT METHOD-
In this method we use the swing points or the HH- HL OR LH-LL points for placing sl,
In this method we trail our sl when the stock make a Higher low after our entry and keep Trailing the sl till it hits. pic.twitter.com/CqzCkLdWmC
You May Also Like

Took me 5 years to get the best Chartink scanners for Stock Market, but you’ll get it in 5 mminutes here ⏰
Do Share the above tweet 👆
These are going to be very simple yet effective pure price action based scanners, no fancy indicators nothing - hope you liked it.
https://t.co/JU0MJIbpRV
52 Week High
One of the classic scanners very you will get strong stocks to Bet on.
https://t.co/V69th0jwBr
Hourly Breakout
This scanner will give you short term bet breakouts like hourly or 2Hr breakout
Volume shocker
Volume spurt in a stock with massive X times


1/OK, data mystery time.
This New York Times feature shows China with a Gini Index of less than 30, which would make it more equal than Canada, France, or the Netherlands. https://t.co/g3Sv6DZTDE
That's weird. Income inequality in China is legendary.
Let's check this number.
2/The New York Times cites the World Bank's recent report, "Fair Progress? Economic Mobility across Generations Around the World".
The report is available here:
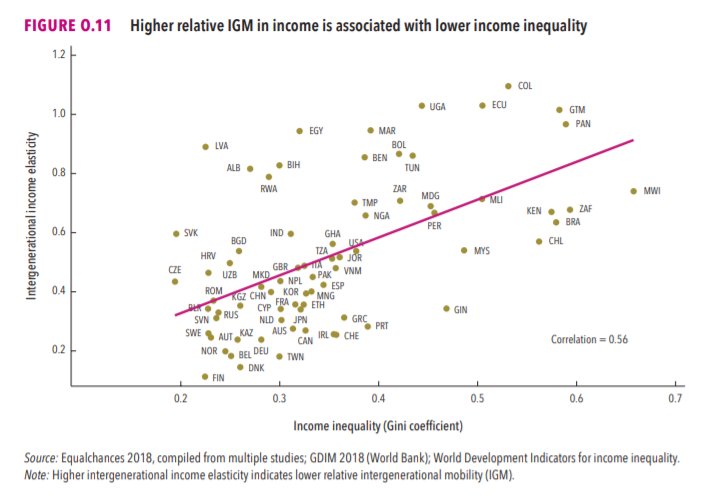
3/The World Bank report has a graph in which it appears to show the same value for China's Gini - under 0.3.
The graph cites the World Development Indicators as its source for the income inequality data.
4/The World Development Indicators are available at the World Bank's website.
Here's the Gini index: https://t.co/MvylQzpX6A
It looks as if the latest estimate for China's Gini is 42.2.
That estimate is from 2012.
5/A Gini of 42.2 would put China in the same neighborhood as the U.S., whose Gini was estimated at 41 in 2013.
I can't find the <30 number anywhere. The only other estimate in the tables for China is from 2008, when it was estimated at 42.8.
This New York Times feature shows China with a Gini Index of less than 30, which would make it more equal than Canada, France, or the Netherlands. https://t.co/g3Sv6DZTDE
That's weird. Income inequality in China is legendary.
Let's check this number.
2/The New York Times cites the World Bank's recent report, "Fair Progress? Economic Mobility across Generations Around the World".
The report is available here:
3/The World Bank report has a graph in which it appears to show the same value for China's Gini - under 0.3.
The graph cites the World Development Indicators as its source for the income inequality data.
4/The World Development Indicators are available at the World Bank's website.
Here's the Gini index: https://t.co/MvylQzpX6A
It looks as if the latest estimate for China's Gini is 42.2.
That estimate is from 2012.
5/A Gini of 42.2 would put China in the same neighborhood as the U.S., whose Gini was estimated at 41 in 2013.
I can't find the <30 number anywhere. The only other estimate in the tables for China is from 2008, when it was estimated at 42.8.