#INDICATORS
All my TV indicators can be accessed by adding to favorites from the below link:
https://t.co/vSyPBEvnLY
Notable ones r:
1) JPMUPS - contains all the pivots
2) Pivotshift
3) ADMIN
4) DPW
5) Pivotwidth for next session
......
and much more.
More from HMK alias MANOJ
#Freetip
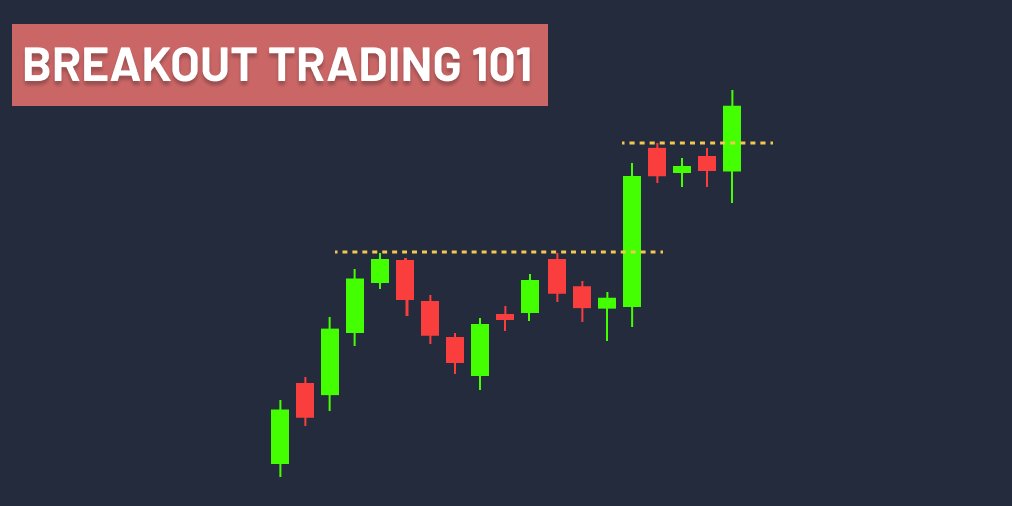
Today's move is an example of this tweet. Save this chart for future ref. https://t.co/amUhSLrET3
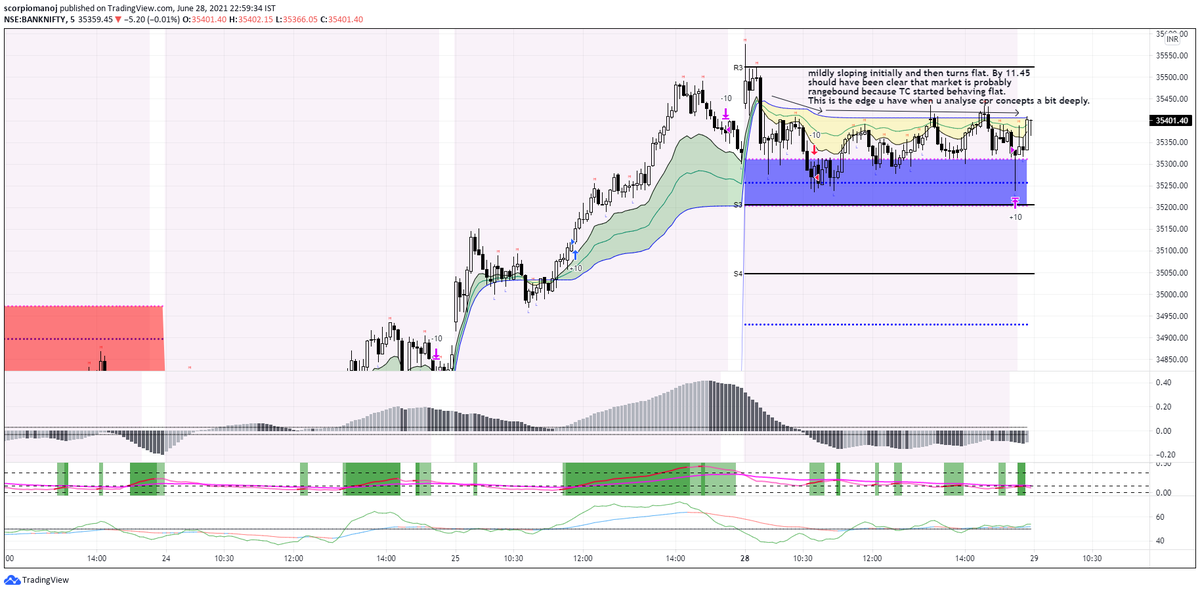
Today's move is an example of this tweet. Save this chart for future ref. https://t.co/amUhSLrET3
#FreeTip
— HMK alias MANOJ (@scorpiomanojFRM) June 23, 2021
A general rule to assess if a market is ranging is to look at developing TC and / or developing BC. If either of them is flat, it means market is currently ranging. If you are trading in 5 min, go to a lower tf chart, say, 2 min to have a less lagging assessment.
More from Stockslearnings


Should you add more in Equity or redeem right now?
A thread 🧵to guide retail on why & what should they do at these historic market highs.
Do ‘re-tweet’ and help us educate more retail investors (1/n)
#investing #StockMarket
Some investors feel that markets are trading at a PE of 27 vs 10 years historical average of 20 and a market-cap to GDP of 105 vs historical average of 79 and hence markets look expensive (2/n)
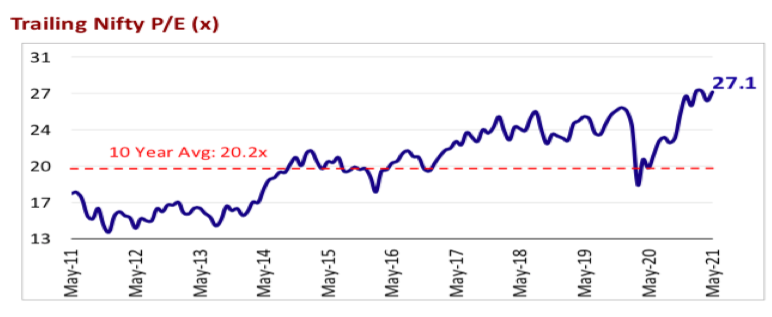
But, in such crazy liquidity driven markets, prices can move much ahead of the fundamentals & suddenly we start hearing commentaries of how the market is pricing in the earnings of FY 22 & 23 to justify the rally
If you r new to fundamentals, 👇 can help
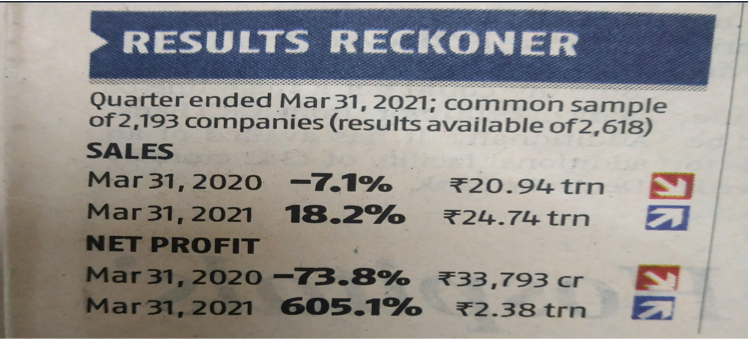
Results for Q4 have come out very well but that is also because of the lower base effect of the last year.
Over the last many years, markets have corrected 10-15% each calendar year. Can it happen this year as well? Can very much and that can be a great entry point. Why? (4/n)
There are a lot of over hangs in the near term,
-Crude going up
-$ index moving up
-Inflation moving up
-COVID uncertainties
All of the above are –ve for markets & liquidity on the other side driving markets up, its impossible to judge the near term movement of the markets (5/n)
A thread 🧵to guide retail on why & what should they do at these historic market highs.
Do ‘re-tweet’ and help us educate more retail investors (1/n)
#investing #StockMarket
Some investors feel that markets are trading at a PE of 27 vs 10 years historical average of 20 and a market-cap to GDP of 105 vs historical average of 79 and hence markets look expensive (2/n)
But, in such crazy liquidity driven markets, prices can move much ahead of the fundamentals & suddenly we start hearing commentaries of how the market is pricing in the earnings of FY 22 & 23 to justify the rally
If you r new to fundamentals, 👇 can help
Market PE at 40 and yet the market is not falling, why? Getting asked this question multiple times. Here's a thread covering \u2018very basic\u2019 premier on valuation for my retail investor friends.
— Kirtan A Shah (@KirtanShahCFP) January 14, 2021
Do hit the \u2018re-tweet\u2019 and help us educate more investors (1/n) pic.twitter.com/8oCkBmmOXY
Results for Q4 have come out very well but that is also because of the lower base effect of the last year.
Over the last many years, markets have corrected 10-15% each calendar year. Can it happen this year as well? Can very much and that can be a great entry point. Why? (4/n)
There are a lot of over hangs in the near term,
-Crude going up
-$ index moving up
-Inflation moving up
-COVID uncertainties
All of the above are –ve for markets & liquidity on the other side driving markets up, its impossible to judge the near term movement of the markets (5/n)