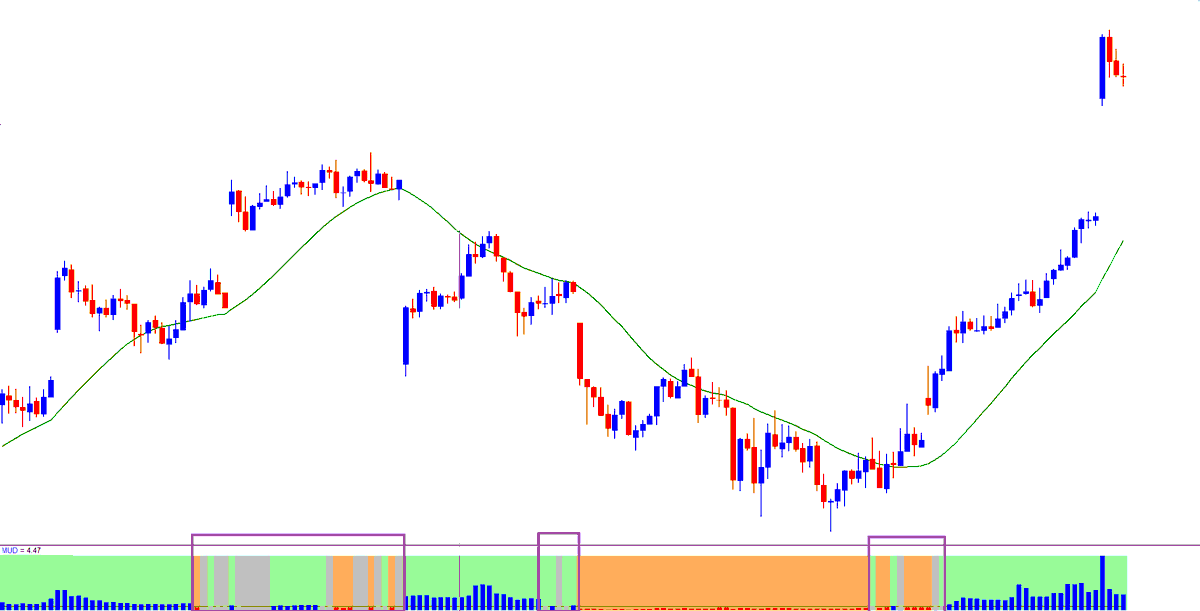
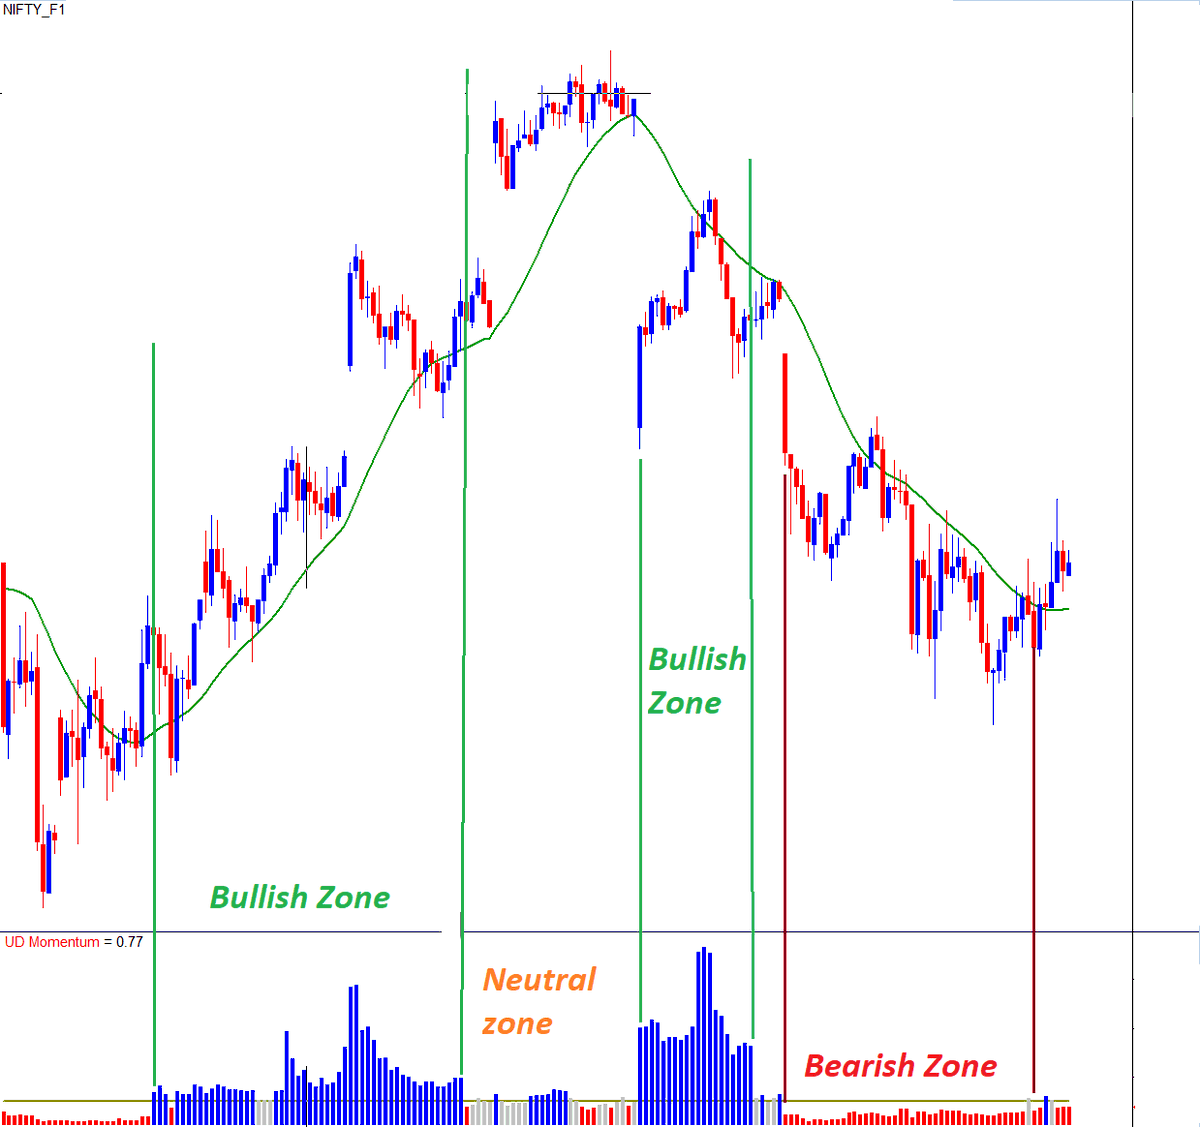
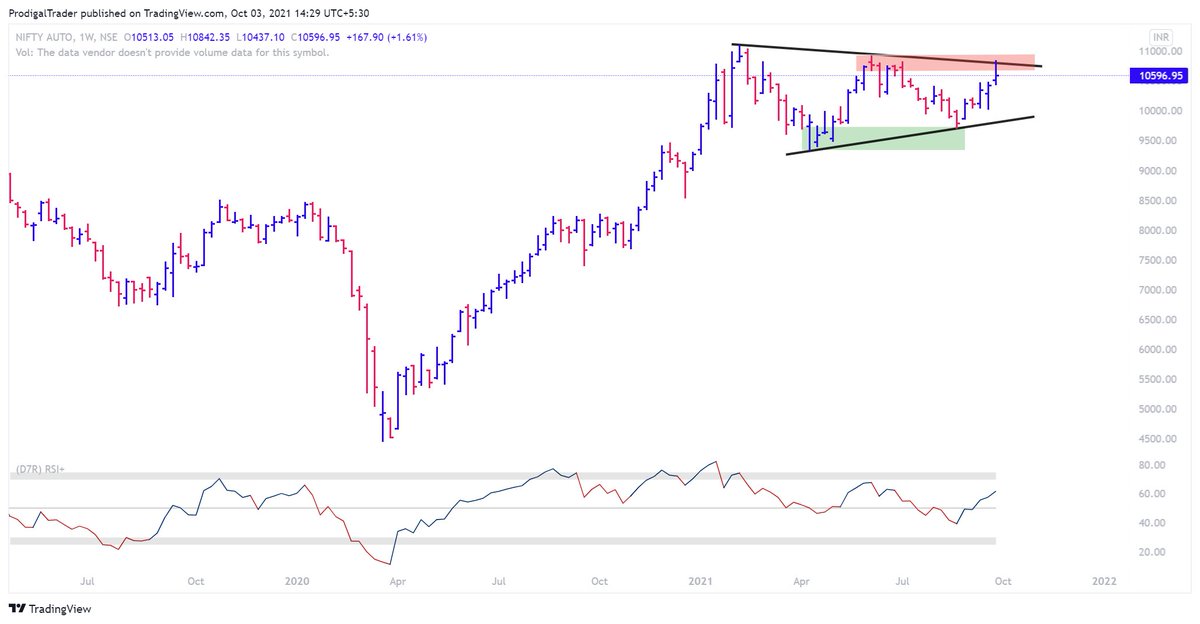
Momentum always fade before it reverses. No abrupt reversal in it.
U can see in the pic below, it always passess through a choppy zone, before trend reversal to give a clear momentum.
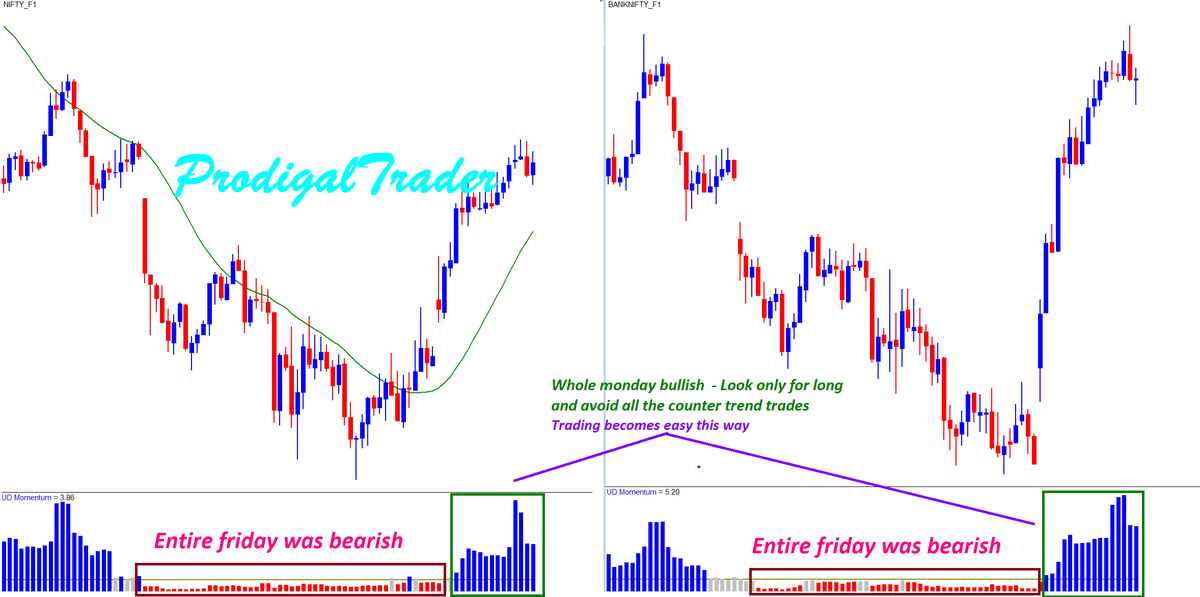
With a huge gap up and no follow through today, price is still not bearish
means no short now
More from Aneesh Philomina Antony
https://t.co/3eAoEqM7QQ up trending market look for pin bar with good volume
2.Rsi divergence and macd histogram divergence both at the same time on 3 min chart
https://t.co/qrAH9PZ6D3 = Low (15min)
1/7
4.ORB with 15 min candle stick along with support and resistance of previous 5 days
5.Pullbacks in Strong momentum (wide range candles + Volume) stocks
6.ORB with volatility contraction and then wide range candle breakout with volume expansion
2/7
7.Fakeout like spring and Upthrust for entry pullback with low volume
8.CPR analysis with standard pivots
9.PDH/PDL breakout with volume, vwap and RSI confirmation
3/7
10.Horizontal support/resistance from HTF and confirmation of acceptance or rejection in lower timeframe as reversal candlestick patterns with volume confirmation
https://t.co/75kykbExlg writing data and Put Writing data in correlation with price action
4/7
12.Pivots (Fibonacci) and Price action with volume activity
13.Ichimoku set ups with previous day NR4/NR7 scrips with pivots and volume as trading tools
https://t.co/JcwqOZS5L4 and rejections on 100/200 ema
15.EMA20 and rsi divergence with daily trend structure
5/7
More from Stockslearnings
U can guage the strength in the trend once u know how to measure the direction.
This trend strength is infact signals the trend continuity or the potetnial for sustanining the trend.
Thats great assurace to hav https://t.co/HanLvlXkjQ
Before making ur trade entry or even before making a bias of trend as either bullish or bearish, do u use any objective measures to define the trend based on price, volume and momentum?
— Aneesh Philomina Antony (@ProdigalTrader) May 15, 2021
Price will always go back and forth move no matter how strong the trend is.
1/4 pic.twitter.com/qqizh2JO3J


You May Also Like


There is co-ordination across the far right in Ireland now to stir both left and right in the hopes of creating a race war. Think critically! Fascists see the tragic killing of #georgenkencho, the grief of his community and pending investigation as a flashpoint for action.
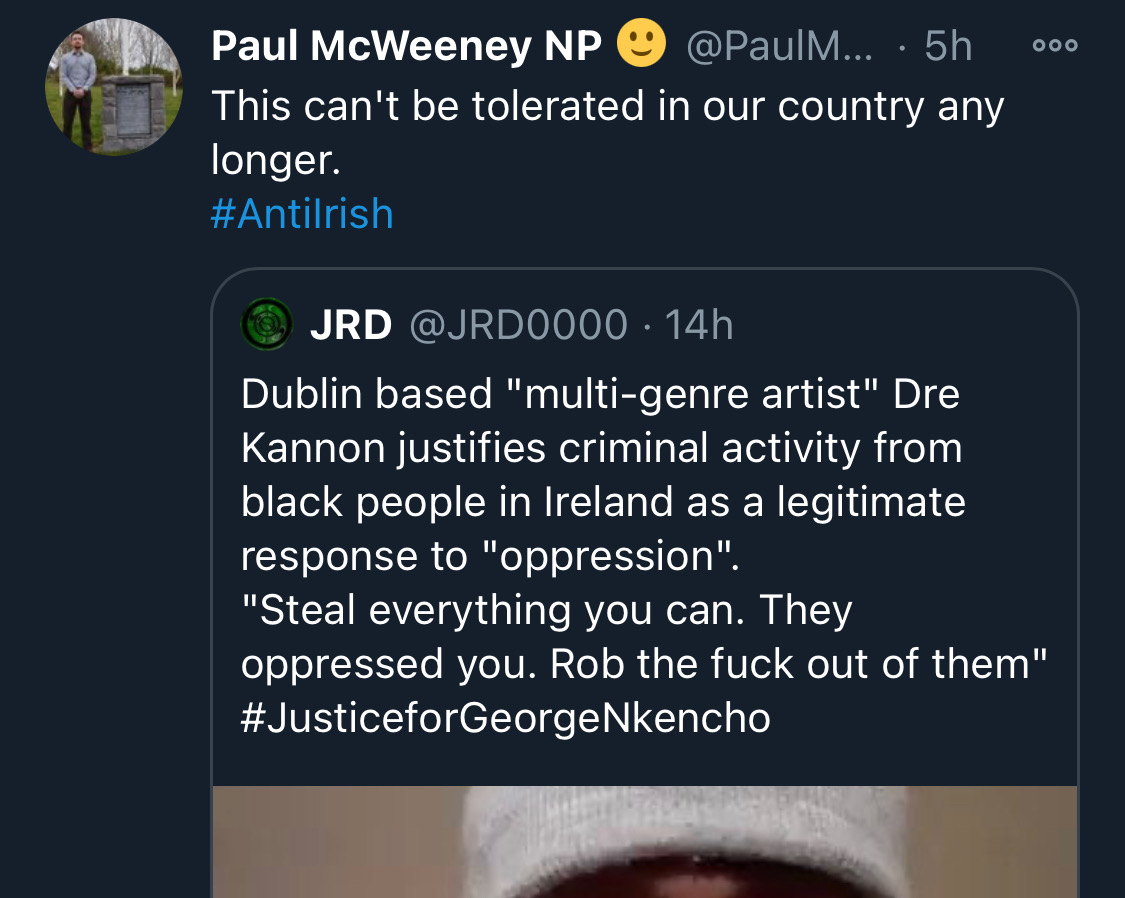
Across Telegram, Twitter and Facebook disinformation is being peddled on the back of these tragic events. From false photographs to the tactics ofwhite supremacy, the far right is clumsily trying to drive hate against minority groups and figureheads.
Be aware, the images the #farright are sharing in the hopes of starting a race war, are not of the SPAR employee that was punched. They\u2019re older photos of a Everton fan. Be aware of the information you\u2019re sharing and that it may be false. Always #factcheck #GeorgeNkencho pic.twitter.com/4c9w4CMk5h
— antifa.drone (@antifa_drone) December 31, 2020
Declan Ganley’s Burkean group and the incel wing of National Party (Gearóid Murphy, Mick O’Keeffe & Co.) as well as all the usuals are concerted in their efforts to demonstrate their white supremacist cred. The quiet parts are today being said out loud.
There is a concerted effort in far-right Telegram groups to try and incite violence on street by targetting people for racist online abuse following the killing of George Nkencho
— Mark Malone (@soundmigration) January 1, 2021
This follows on and is part of a misinformation campaign to polarise communities at this time.
The best thing you can do is challenge disinformation and report posts where engagement isn’t appropriate. Many of these are blatantly racist posts designed to drive recruitment to NP and other Nationalist groups. By all means protest but stay safe.