In his recent article, @cjsnowdon claims that England's November lockdown was a good example of lockdown effectiveness. Let’s look at that claim using the ONS death-by-date registration data which have now been updated for the relevant period.
So what actually happened?
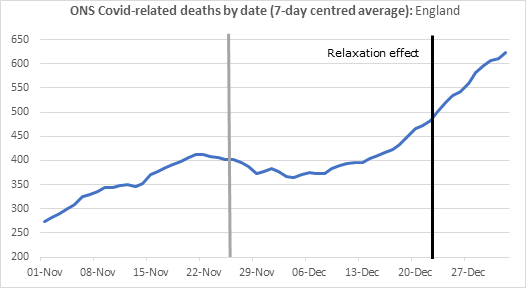
Deaths increase again from 4 Dec implying infections increased right in the middle of the national lockdown.
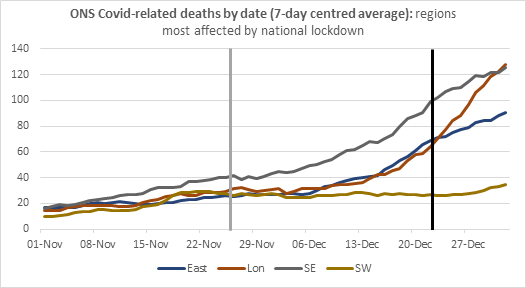
Also, as these areas largely returned to lower tiers on 2 Dec, relaxation shd have a bigger adverse effect than in North/Mids.
What do we see?
Similarly no clear, consistent effect after LD2 lifted.
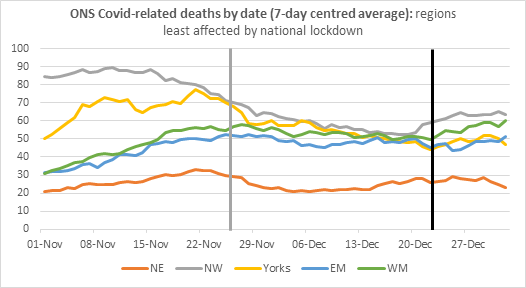
Poss SE & L stabilised a little after LD but briefly. No consistent effect on trends from Dec relaxation: perhaps L accelerates a bit, but E slows down. SW little affected by either.