
For those wondering what the causes are of Texas blackouts, @JesseJenkins is doing a really good real time analysis of generator capacity and operation. (Short story: we have a natural gas problem in TX). A few additional thoughts to add:
Confidential info from a market participant in ERCOT: As of ~10 AM Eastern time, the system has ~30 GW of capacity offline, ~26 GW of thermal -- mostly natural gas which cant get fuel deliveries which are being priorities for heating loads -- and ~4 GW of wind due to icing. https://t.co/Bfpn0WeRIq
— JesseJenkins (@JesseJenkins) February 15, 2021
More from Society

Sandbank Danger, A Thread

Controversy Has Been Caused By The Digging Of A Narrow Channel By A Resort On A Sandbank Near K. Hinmafushi.

Hinmafushi Council President Shan Ibrahim Stated To Sun That The Resort, Which Dug The Trench Creating A River On The Sandbank, Did Not Have Ownership Over The Sandbank.
Officials From The Island Of Hinmafushi Had Traveled To The Sandbank To Stop The Process Of Digging The Trench When They Became Aware Of It, Said Shan.
Officials Were Now Redepositing The Sand Removed From The Sandbank.
Controversy Has Been Caused By The Digging Of A Narrow Channel By A Resort On A Sandbank Near K. Hinmafushi.
Hinmafushi Council President Shan Ibrahim Stated To Sun That The Resort, Which Dug The Trench Creating A River On The Sandbank, Did Not Have Ownership Over The Sandbank.
Officials From The Island Of Hinmafushi Had Traveled To The Sandbank To Stop The Process Of Digging The Trench When They Became Aware Of It, Said Shan.
Officials Were Now Redepositing The Sand Removed From The Sandbank.
— Ahmed Aznil (@AhmedAznil) January 21, 2021


global health policy in 2020 has centered around NPI's (non-pharmaceutical interventions) like distancing, masks, school closures
these have been sold as a way to stop infection as though this were science.
this was never true and that fact was known and knowable.
let's look.
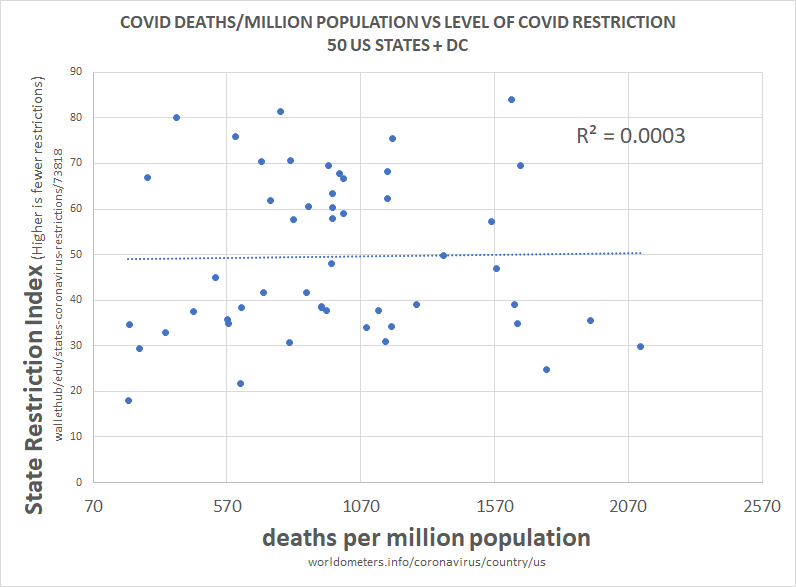
above is the plot of social restriction and NPI vs total death per million. there is 0 R2. this means that the variables play no role in explaining one another.
we can see this same relationship between NPI and all cause deaths.
this is devastating to the case for NPI.
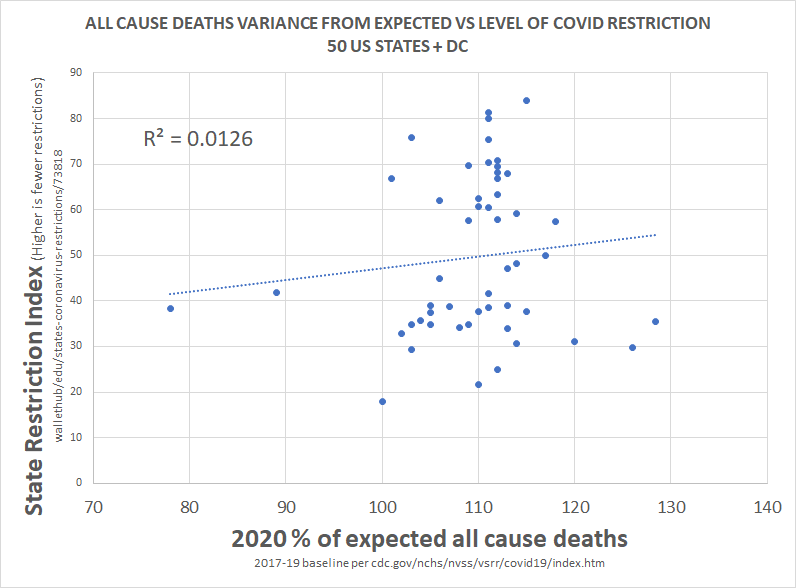
clearly, correlation is not proof of causality, but a total lack of correlation IS proof that there was no material causality.
barring massive and implausible coincidence, it's essentially impossible to cause something and not correlate to it, especially 51 times.
this would seem to pose some very serious questions for those claiming that lockdowns work, those basing policy upon them, and those claiming this is the side of science.
there is no science here nor any data. this is the febrile imaginings of discredited modelers.
this has been clear and obvious from all over the world since the beginning and had been proven so clearly by may that it's hard to imagine anyone who is actually conversant with the data still believing in these responses.
everyone got the same R
these have been sold as a way to stop infection as though this were science.
this was never true and that fact was known and knowable.
let's look.
above is the plot of social restriction and NPI vs total death per million. there is 0 R2. this means that the variables play no role in explaining one another.
we can see this same relationship between NPI and all cause deaths.
this is devastating to the case for NPI.
clearly, correlation is not proof of causality, but a total lack of correlation IS proof that there was no material causality.
barring massive and implausible coincidence, it's essentially impossible to cause something and not correlate to it, especially 51 times.
this would seem to pose some very serious questions for those claiming that lockdowns work, those basing policy upon them, and those claiming this is the side of science.
there is no science here nor any data. this is the febrile imaginings of discredited modelers.
this has been clear and obvious from all over the world since the beginning and had been proven so clearly by may that it's hard to imagine anyone who is actually conversant with the data still believing in these responses.
everyone got the same R
this methodology is a little complex, so let me explain what i did.
— el gato malo (@boriquagato) May 30, 2020
a few EU countries provide real day of death data. this lets us plot meaningful curves to show rate of disease change.
what struck me is how similar all the curves were.
everyone got the same shape. pic.twitter.com/bN0hILzoSl

This is a piece I've been thinking about for a long time. One of the most dominant policy ideas in Washington is that policy should, always and everywhere, move parents into paid labor. But what if that's wrong?
My reporting here convinced me that there's no large effect in either direction on labor force participation from child allowances. Canada has a bigger one than either Romney or Biden are considering, and more labor force participation among women.
But what if that wasn't true?
Forcing parents into low-wage, often exploitative, jobs by threatening them and their children with poverty may be counted as a success by some policymakers, but it’s a sign of a society that doesn’t value the most essential forms of labor.
The problem is in the very language we use. If I left my job as a New York Times columnist to care for my 2-year-old son, I’d be described as leaving the labor force. But as much as I adore him, there is no doubt I’d be working harder. I wouldn't have stopped working!
I tried to render conservative objections here fairly. I appreciate that @swinshi talked with me, and I'm sorry I couldn't include everything he said. I'll say I believe I used his strongest arguments, not more speculative ones, in the piece.
I appreciate his intellectual curiosity and effort. I have quibbles. But my big disappointment is there was no mention of unintended consequences, which we discussed and which are kind of THE core conservative concern on this issue.
— \U0001d682\U0001d68c\U0001d698\U0001d69d\U0001d69d \U0001d686\U0001d692\U0001d697\U0001d69c\U0001d691\U0001d692\U0001d699 (@swinshi) February 18, 2021

You May Also Like


Nano Course On Python For Trading
==========================
Module 1
Python makes it very easy to analyze and visualize time series data when you’re a beginner. It's easier when you don't have to install python on your PC (that's why it's a nano course, you'll learn python...
... on the go). You will not be required to install python in your PC but you will be using an amazing python editor, Google Colab Visit https://t.co/EZt0agsdlV
This course is for anyone out there who is confused, frustrated, and just wants this python/finance thing to work!
In Module 1 of this Nano course, we will learn about :
# Using Google Colab
# Importing libraries
# Making a Random Time Series of Black Field Research Stock (fictional)
# Using Google Colab
Intro link is here on YT: https://t.co/MqMSDBaQri
Create a new Notebook at https://t.co/EZt0agsdlV and name it AnythingOfYourChoice.ipynb
You got your notebook ready and now the game is on!
You can add code in these cells and add as many cells as you want
# Importing Libraries
Imports are pretty standard, with a few exceptions.
For the most part, you can import your libraries by running the import.
Type this in the first cell you see. You need not worry about what each of these does, we will understand it later.


