There are different ways to estimate it, depending on the factor. Simplest is factors like industry or country exposure where the entries can be 0/1 depending on whether the stock is in that industry/country or not.
A few things that I didn't cover yesterday when I talked about equity factor models (it's a huge area and it's impossible to more than scrape the surface)
A few people in the DMs asking about equity factor models so here's a short explainer.
— macrocephalopod (@macrocephalopod) February 2, 2021
Let's make it a concrete problem -- you are the risk manager at a big multi-manager hedge fund with ~100 sub-PMs each of whom has a portfolio of 10-50 stocks, long and short.
There are different ways to estimate it, depending on the factor. Simplest is factors like industry or country exposure where the entries can be 0/1 depending on whether the stock is in that industry/country or not.
Now you have a set of linear equations on each day, and you can solve the linear equations to get the vector of factor returns for each day using the normal equation - pic.twitter.com/YwVkUzSM69
— macrocephalopod (@macrocephalopod) February 2, 2021
It varies depending on the application. The simplest models would have just a few, maybe the market factor plus a couple of others that you care about (think about Fama-French 3 factor or 5 factor model) but it will normally be more.
Yes -- you hear a lot about the well known ones like value, momentum quality etc but there are hundreds of others which are widely known in academia and industry and thousands of proprietary in-house factors.
More from Society
1/OK, data mystery time.
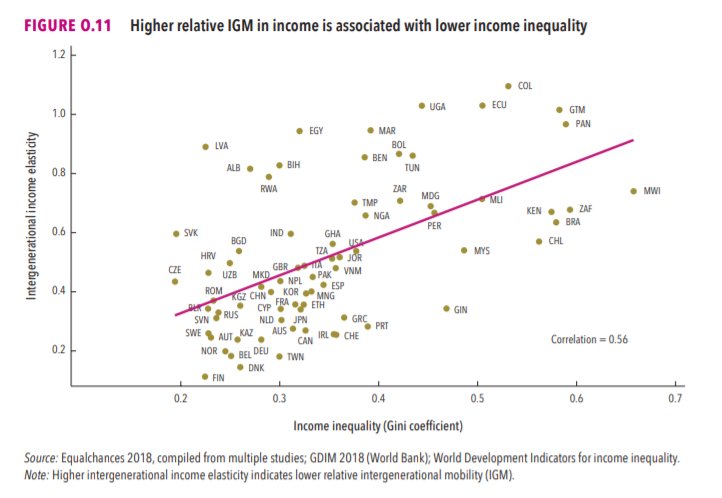
This New York Times feature shows China with a Gini Index of less than 30, which would make it more equal than Canada, France, or the Netherlands. https://t.co/g3Sv6DZTDE
That's weird. Income inequality in China is legendary.
Let's check this number.
2/The New York Times cites the World Bank's recent report, "Fair Progress? Economic Mobility across Generations Around the World".
The report is available here:
3/The World Bank report has a graph in which it appears to show the same value for China's Gini - under 0.3.
The graph cites the World Development Indicators as its source for the income inequality data.

4/The World Development Indicators are available at the World Bank's website.
Here's the Gini index: https://t.co/MvylQzpX6A
It looks as if the latest estimate for China's Gini is 42.2.
That estimate is from 2012.
5/A Gini of 42.2 would put China in the same neighborhood as the U.S., whose Gini was estimated at 41 in 2013.
I can't find the <30 number anywhere. The only other estimate in the tables for China is from 2008, when it was estimated at 42.8.
This New York Times feature shows China with a Gini Index of less than 30, which would make it more equal than Canada, France, or the Netherlands. https://t.co/g3Sv6DZTDE
That's weird. Income inequality in China is legendary.
Let's check this number.
2/The New York Times cites the World Bank's recent report, "Fair Progress? Economic Mobility across Generations Around the World".
The report is available here:
3/The World Bank report has a graph in which it appears to show the same value for China's Gini - under 0.3.
The graph cites the World Development Indicators as its source for the income inequality data.

4/The World Development Indicators are available at the World Bank's website.
Here's the Gini index: https://t.co/MvylQzpX6A
It looks as if the latest estimate for China's Gini is 42.2.
That estimate is from 2012.
5/A Gini of 42.2 would put China in the same neighborhood as the U.S., whose Gini was estimated at 41 in 2013.
I can't find the <30 number anywhere. The only other estimate in the tables for China is from 2008, when it was estimated at 42.8.


