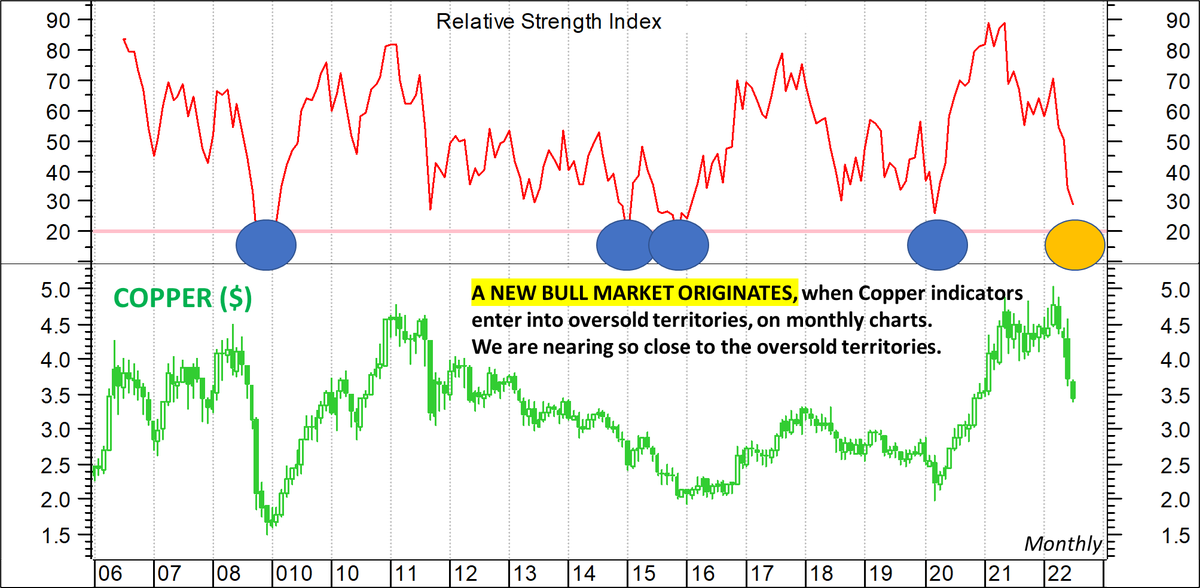
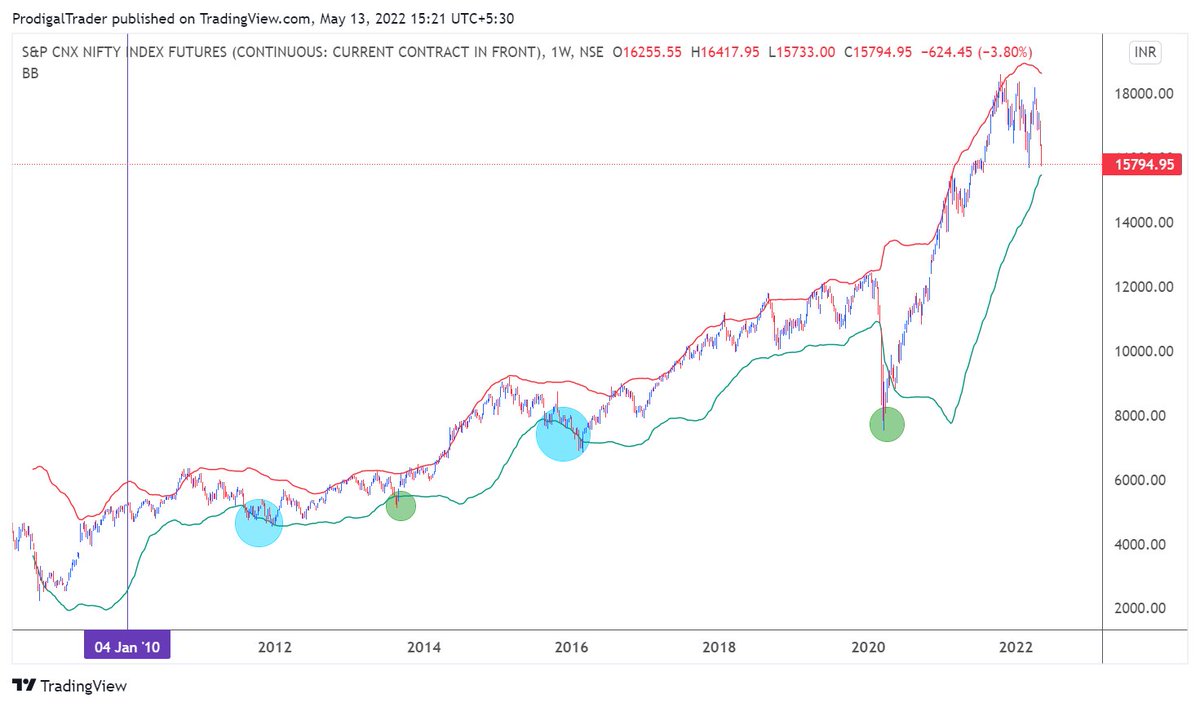
Do u want to study past bear markets?
Use Weekly chart
Plot Bollinger Bands with 50,2 setting
Locate when ever price hit lower band
Locate the highest swing high befoire the fall
The period in between is bear market
Here we have 4 such occations after 2010.
More from Aneesh Philomina Antony (ProdigalTrader)
Few concepts upon which day trading systems can be built upon
https://t.co/3eAoEqM7QQ up trending market look for pin bar with good volume
2.Rsi divergence and macd histogram divergence both at the same time on 3 min chart
https://t.co/qrAH9PZ6D3 = Low (15min)
1/7
4.ORB with 15 min candle stick along with support and resistance of previous 5 days
5.Pullbacks in Strong momentum (wide range candles + Volume) stocks
6.ORB with volatility contraction and then wide range candle breakout with volume expansion
2/7
7.Fakeout like spring and Upthrust for entry pullback with low volume
8.CPR analysis with standard pivots
9.PDH/PDL breakout with volume, vwap and RSI confirmation
3/7
10.Horizontal support/resistance from HTF and confirmation of acceptance or rejection in lower timeframe as reversal candlestick patterns with volume confirmation
https://t.co/75kykbExlg writing data and Put Writing data in correlation with price action
4/7
12.Pivots (Fibonacci) and Price action with volume activity
13.Ichimoku set ups with previous day NR4/NR7 scrips with pivots and volume as trading tools
https://t.co/JcwqOZS5L4 and rejections on 100/200 ema
15.EMA20 and rsi divergence with daily trend structure
5/7