Stocks don't pick you, You pick stocks. It's all about process.
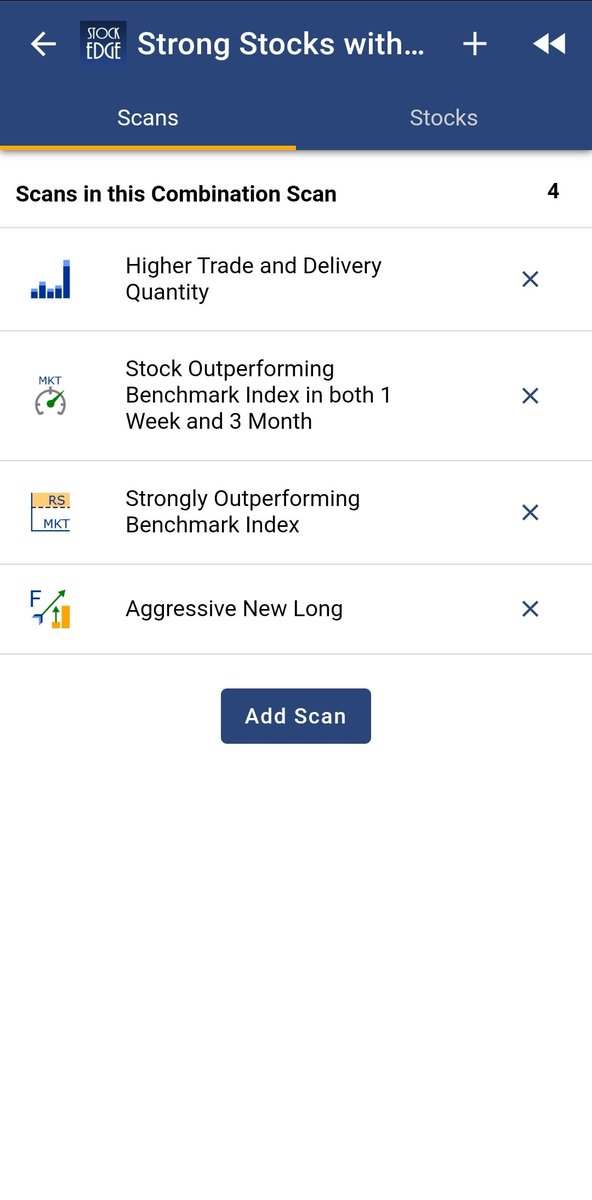
At scientific investing, we ve "ghoomega" strategy n currently 4 stocks. UFO was one example shared
The least to do is observe all charts of @VVVStockAnalyst @charts_zone @Accuracy_Invst n u will get their pattern
Many were telling me that's stocks move after my post
— Volatility Volume and Value (@VVVStockAnalyst) April 18, 2022
Didn't post nahar cap today when I bought and now it's 10% higher
This shows we surf the move and don't make the move \u270c\ufe0f
More from kumar saurabh


#NASDAQ Will NASDAQ crash? How much more correction is to come? How to track?
An extended analysis of the morning tweet is in this Youtube video. Like and retweet for wider reach
morning tweet on NASDAQ
An extended analysis of the morning tweet is in this Youtube video. Like and retweet for wider reach
morning tweet on NASDAQ
#NASDAQ How much NASDAQ can fall?
— kumar saurabh (@suru27) June 14, 2022
Since 2000, this is the 3rd worst fall in NASDAQ
2000: 77% fall from peak
2008: 55% fall from peak
2022: 34% fall from peak pic.twitter.com/MO8KNtzQez
More from Screeners


You May Also Like


A list of cool websites you might now know about
A thread 🧵
1) Learn Anything - Search tools for knowledge discovery that helps you understand any topic through the most efficient
2) Grad Speeches - Discover the best commencement speeches.
This website is made by me
3) What does the Internet Think - Find out what the internet thinks about anything
4) https://t.co/vuhT6jVItx - Send notes that will self-destruct after being read.