Can you observe now that it has made a fresh high?
Repeating - the max. move is in catching them before the BO. At the point where the maximum selling is absorbed. This is called the pivot point. The least risk entry point. The best R:R you get @ pivot
India Glycols https://t.co/ntimbgEoQr
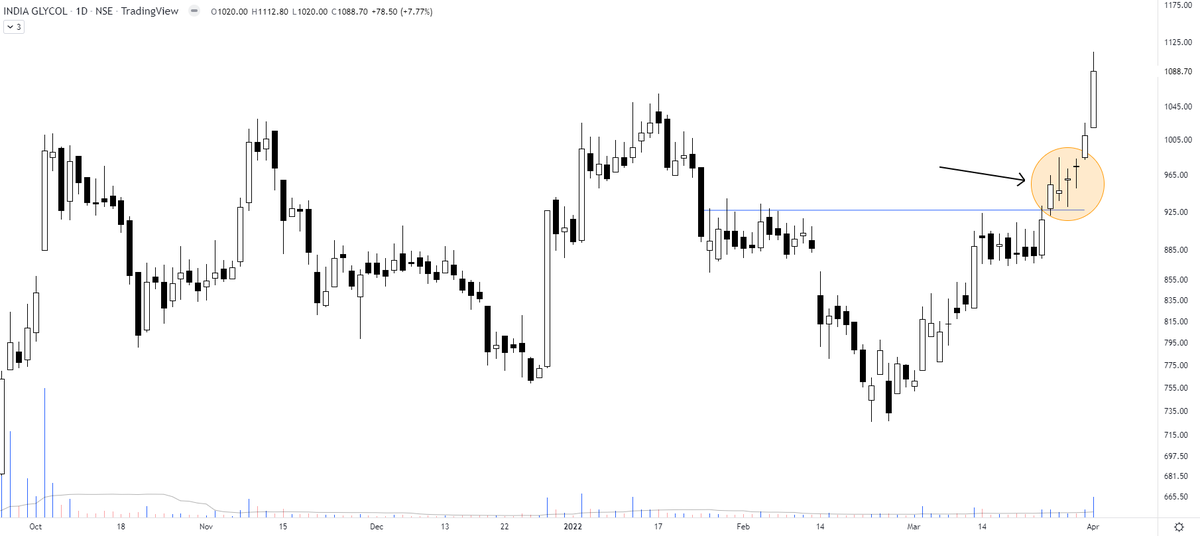
India Glycols - a flat line breakout. Need a good volume confirmation here. pic.twitter.com/gbeloUQjAC
— The_Chartist \U0001f4c8 (@charts_zone) March 28, 2022
More from The_Chartist 📈
More from Screeners


Covering one of the most unique set ups: Extended moves & Reversal plays
Time for a 🧵 to learn the above from @iManasArora
What qualifies for an extended move?
30-40% move in just 5-6 days is one example of extended move
How Manas used this info to book
The stock exploded & went up as much as 63% from my price.
— Manas Arora (@iManasArora) June 22, 2020
Closed my position entirely today!#BroTip pic.twitter.com/CRbQh3kvMM
Post that the plight of the
What an extended (away from averages) move looks like!!
— Manas Arora (@iManasArora) June 24, 2020
If you don't learn to sell into strength, be ready to give away the majority of your gains.#GLENMARK pic.twitter.com/5DsRTUaGO2
Example 2: Booking profits when the stock is extended from 10WMA
10WMA =
#HIKAL
— Manas Arora (@iManasArora) July 2, 2021
Closed remaining at 560
Reason: It is 40+% from 10wma. Super extended
Total revenue: 11R * 0.25 (size) = 2.75% on portfolio
Trade closed pic.twitter.com/YDDvhz8swT
Another hack to identify extended move in a stock:
Too many green days!
Read
When you see 15 green weeks in a row, that's the end of the move. *Extended*
— Manas Arora (@iManasArora) August 26, 2019
Simple price action analysis.#Seamecltd https://t.co/gR9xzgeb9K

You May Also Like

To me, the most important aspect of the 2018 midterms wasn't even about partisan control, but about democracy and voting rights. That's the real battle.
2/The good news: It's now an issue that everyone's talking about, and that everyone cares about.
3/More good news: Florida's proposition to give felons voting rights won. But it didn't just win - it won with substantial support from Republican voters.
That suggests there is still SOME grassroots support for democracy that transcends
4/Yet more good news: Michigan made it easier to vote. Again, by plebiscite, showing broad support for voting rights as an
5/OK, now the bad news.
We seem to have accepted electoral dysfunction in Florida as a permanent thing. The 2000 election has never really
Bad ballot design led to a lot of undervotes for Bill Nelson in Broward Co., possibly even enough to cost him his Senate seat. They do appear to be real undervotes, though, instead of tabulation errors. He doesn't really seem to have a path to victory. https://t.co/utUhY2KTaR
— Nate Silver (@NateSilver538) November 16, 2018

It's all in French, but if you're up for it you can read:
• Their blog post (lacks the most interesting details): https://t.co/PHkDcOT1hy
• Their high-level legal decision: https://t.co/hwpiEvjodt
• The full notification: https://t.co/QQB7rfynha
I've read it so you needn't!
Vectaury was collecting geolocation data in order to create profiles (eg. people who often go to this or that type of shop) so as to power ad targeting. They operate through embedded SDKs and ad bidding, making them invisible to users.
The @CNIL notes that profiling based off of geolocation presents particular risks since it reveals people's movements and habits. As risky, the processing requires consent — this will be the heart of their assessment.
Interesting point: they justify the decision in part because of how many people COULD be targeted in this way (rather than how many have — though they note that too). Because it's on a phone, and many have phones, it is considered large-scale processing no matter what.