Have you ever felt a lack of research as a cause of losing money?
Get out of the trap by focusing on price action and following the market to make money from smart money’s research.


Sir, How do u find a set up - Do you track chart of each stock daily ? Or do u have filters , that lead you to a number of stocks , after which you scan them.
— AKASH GUPTA (@lockdownmurti) August 25, 2021
#FREETIPS
— ScorpioManoj (@scorpiomanojFRM) April 1, 2022
Pivot Rules snapshot
A free one page cheat sheet for pivot based trading that could probably be sold for a hefty price ....
Rem: This is just a broad set of rules. There are many advance rules more than this. pic.twitter.com/FnzmGGKx0P
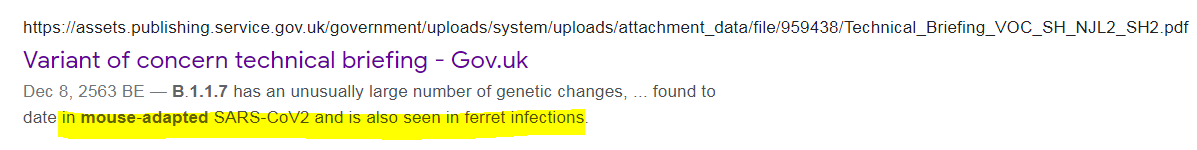
1. From Day 1, SARS-COV-2 was very well adapted to humans .....and transgenic hACE2 Mice
— Billy Bostickson \U0001f3f4\U0001f441&\U0001f441 \U0001f193 (@BillyBostickson) January 30, 2021
"we generated a mouse model expressing hACE2 by using CRISPR/Cas9 knockin technology. In comparison with wild-type C57BL/6 mice, both young & aged hACE2 mice sustained high viral loads... pic.twitter.com/j94XtSkscj
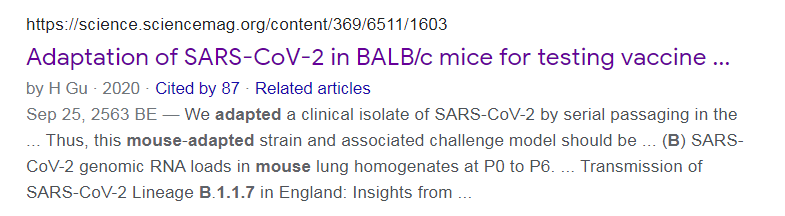
1. High Probability of serial passaging in Transgenic Mice expressing hACE2 in genesis of SARS-COV-2!
— Billy Bostickson \U0001f3f4\U0001f441&\U0001f441 \U0001f193 (@BillyBostickson) January 2, 2021
2 papers:
Human\u2013viral molecular mimicryhttps://t.co/irfH0Zgrve
Molecular Mimicryhttps://t.co/yLQoUtfS6s https://t.co/lsCv2iMEQz