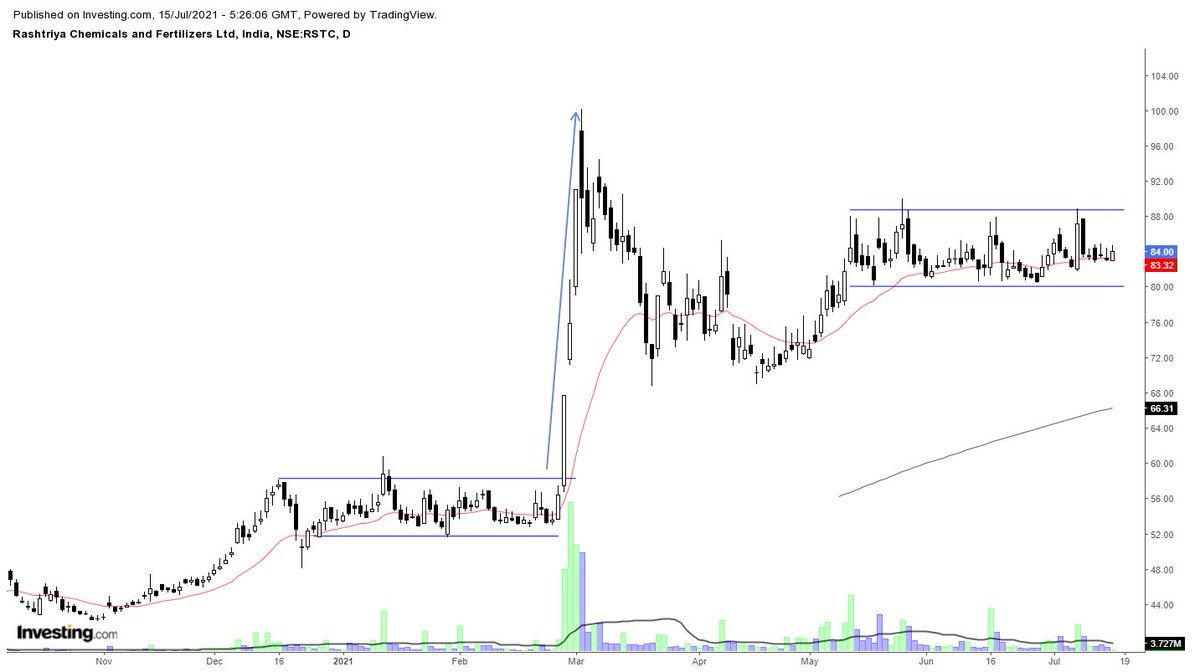
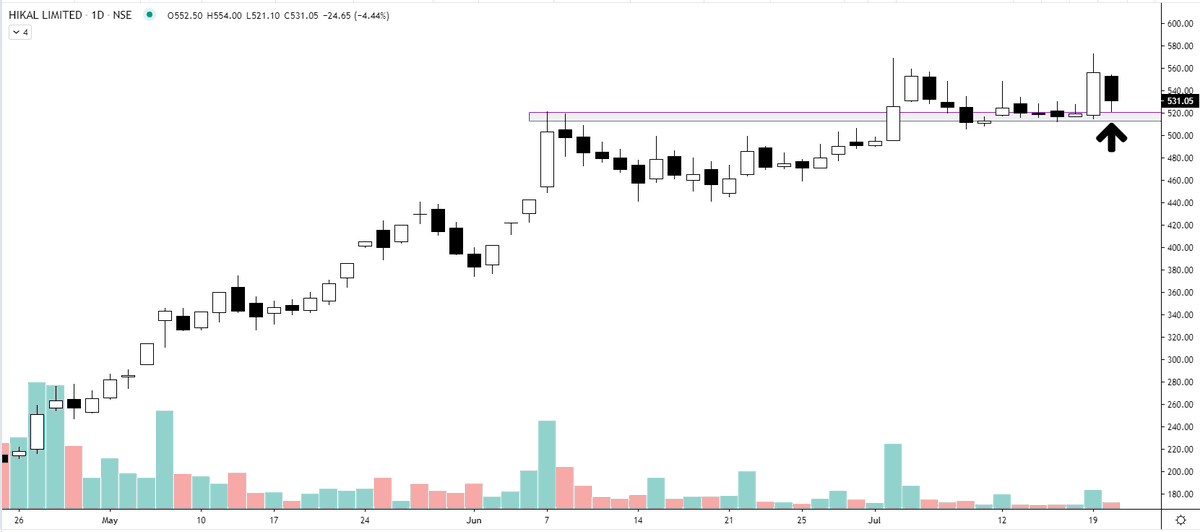
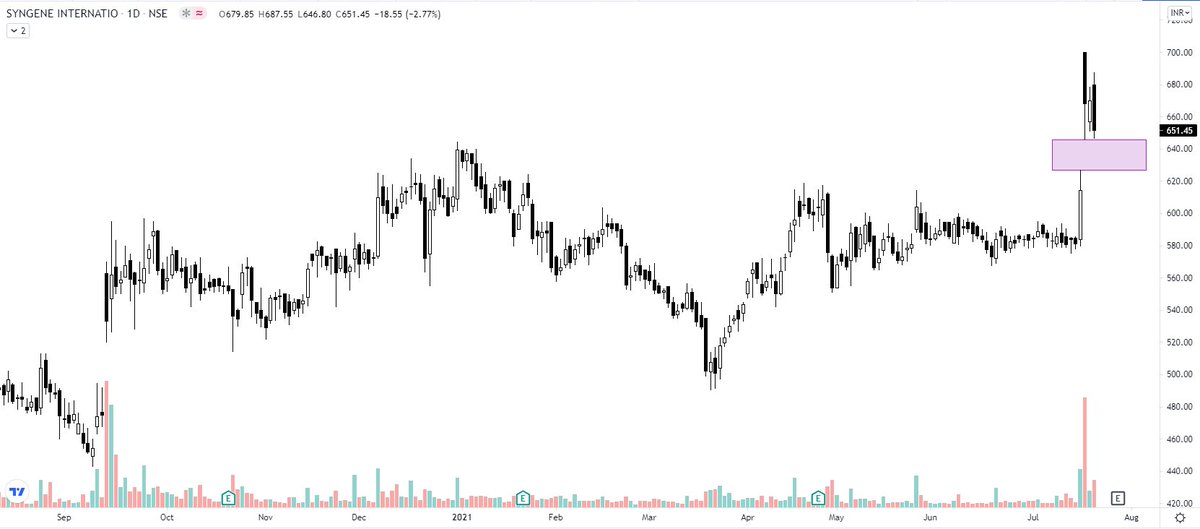
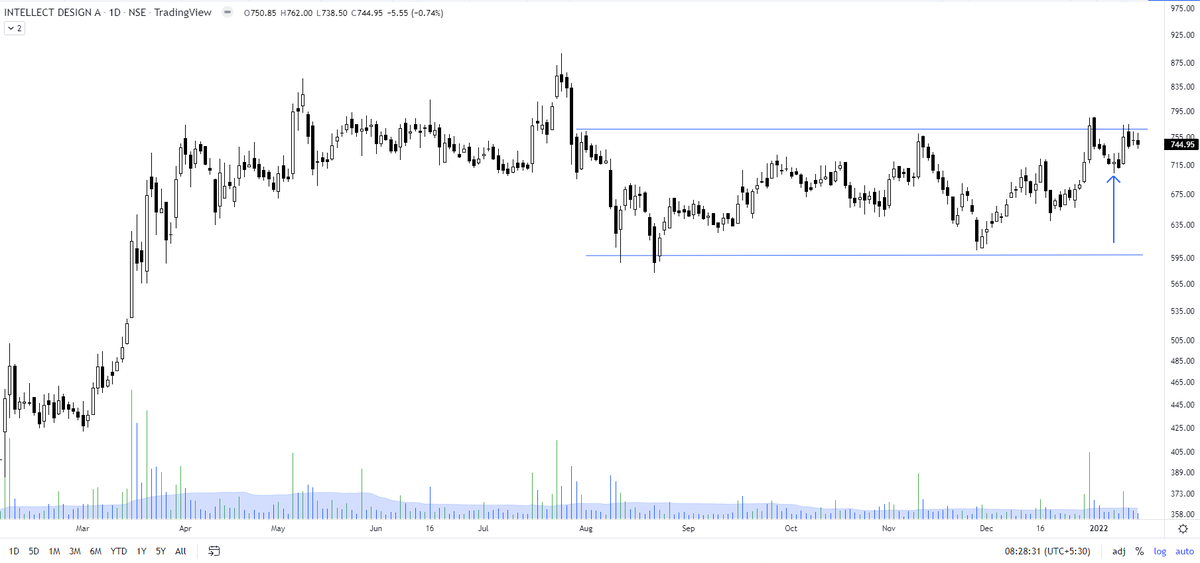
Can you anticipate a breakout? Yes, I shared this before in ICICI Bank case. When the price reverses without going lower till the support. This shows the strength of the buyers. Can you see the same structure in Intellect Design?
PS - conservative traders always wait for the BO https://t.co/o79tNRd9Fo
ICICI Bank #NSE - Can you anticipate a breakout? If you look at point 1,2&3 on the chart in rectangle formation, you will notice the buyer is willing to pay a higher price. The demand zone is shifting upwards which signifies the weakness of sellers & a potential BO to the upside. pic.twitter.com/urGbGz643N
— The_Chartist \U0001f4c8 (@charts_zone) July 23, 2021
More from The_Chartist 📈
Nifty Private Bank https://t.co/BwG1DKhhLc
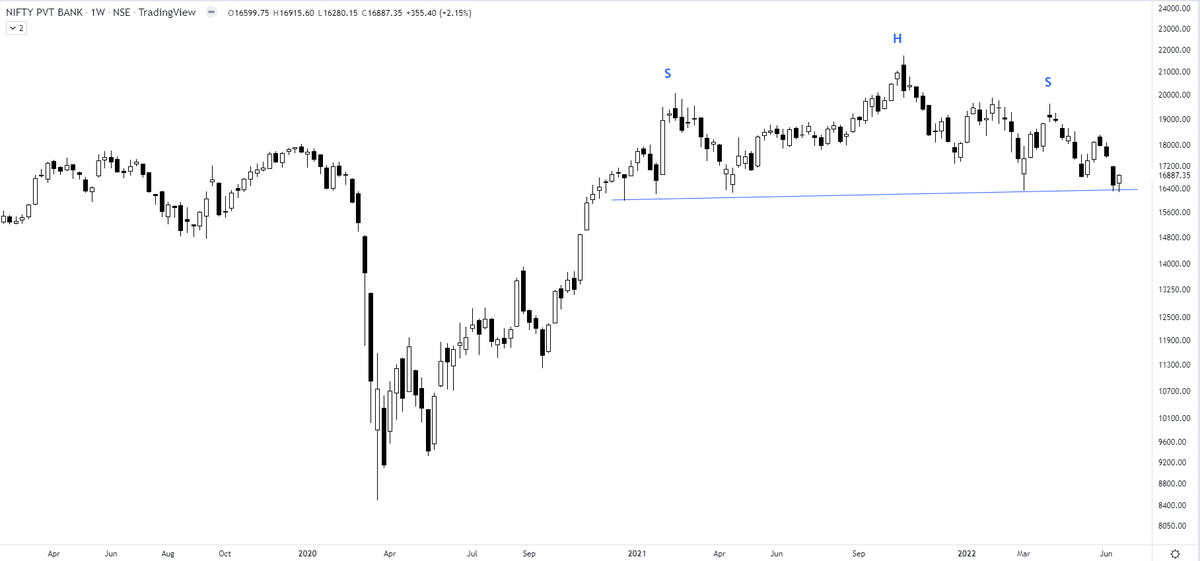
I am watching a big bearish H&S top building up in Nifty Private Bank Index. Any breakdown will result in increased volatility in respective charts. For traders - definitely not a spot to be in. The index has to move beyond 19900 to negate the pattern. pic.twitter.com/IGFeyNrtQV
— The_Chartist \U0001f4c8 (@charts_zone) June 19, 2022
More from Screeners
Do read it completely to understand the stance and the plan.
This thread will present a highly probable scenario of markets for the upcoming months. Will update the scenario too if there is a significant change in view in between.
— Aakash Gangwar (@akashgngwr823) May 15, 2022
1/n https://t.co/jfWOyEgZyd
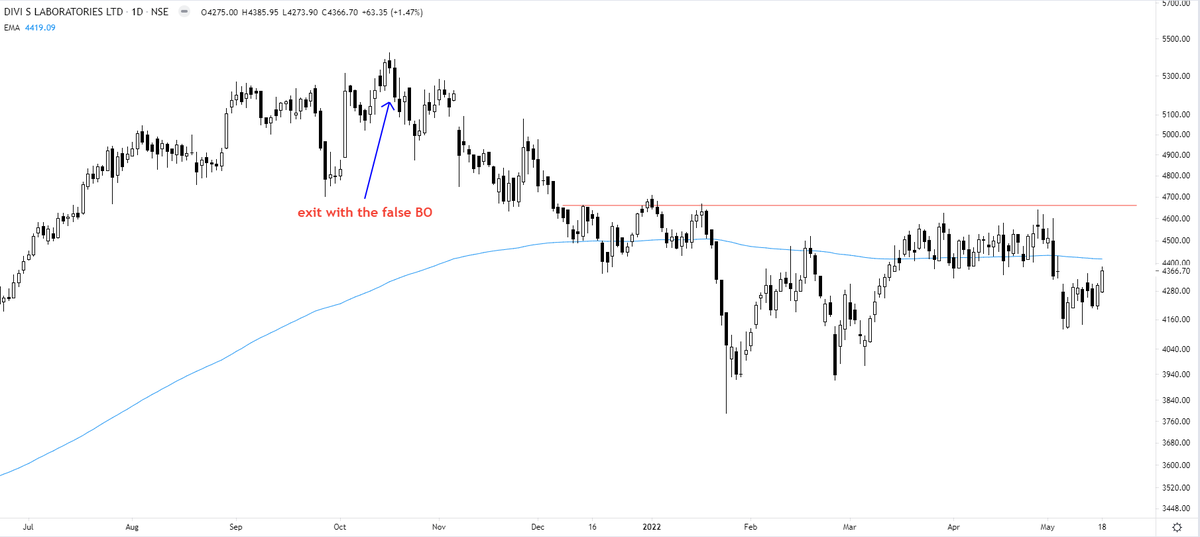
1. The moving average structure - Many traders just look at the 200 ma test or closing above/below it regardless of its slope. Let's look at all the interactions with 200 ma where price met it for the first time after the trend change but with 200 ma slope against it
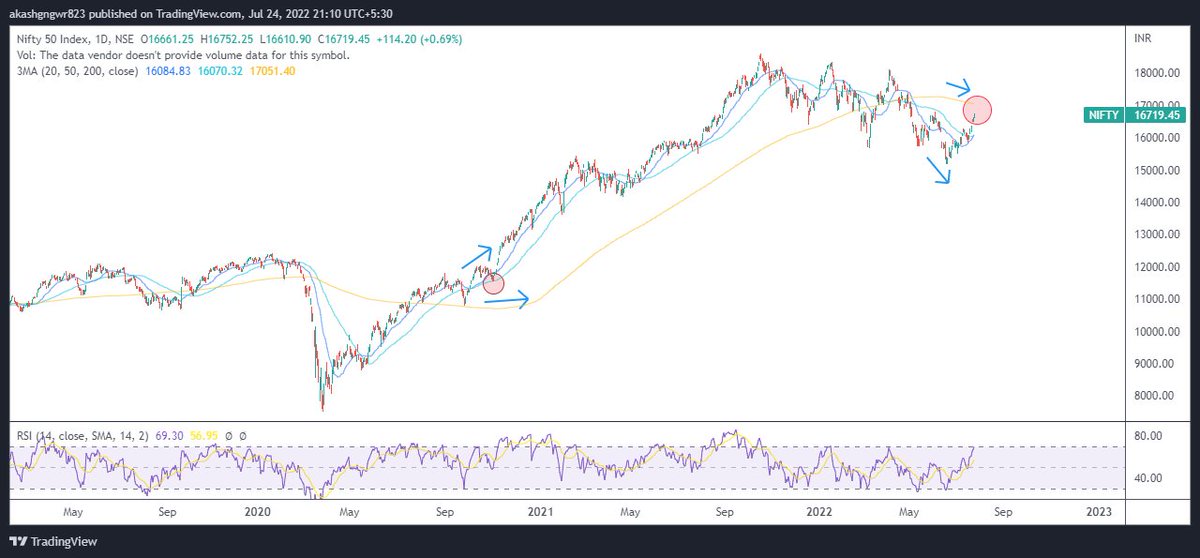
One can clearly sense that currently it is one of those scenarios only. I understand that I might get trolled for this, but an unbiased mind suggests that odds are highly against the bulls for making fresh investments.
But markets are good at giving surprises. What should be our stance if price kept on rising? Let's understand that through charts. The concept is still the same. Divergent 200 ma and price move results in 200 ma test atleast once which gives good investment opportunities.
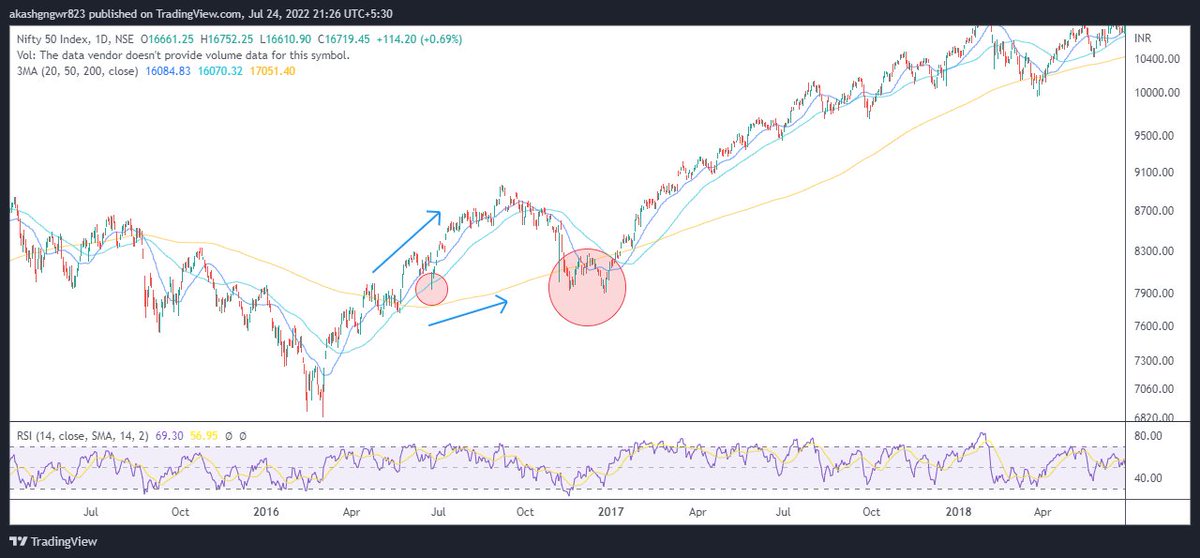
2. Zig-Zag bear market- There are two types of fall in a bear market, the first one is vertical fall which usually ends with ending diagonals (falling wedges) and the second one is zig zag one which usually ends with parabolic down moves.
You May Also Like
Do Share the above tweet 👆
These are going to be very simple yet effective pure price action based scanners, no fancy indicators nothing - hope you liked it.
https://t.co/JU0MJIbpRV
52 Week High
One of the classic scanners very you will get strong stocks to Bet on.
https://t.co/V69th0jwBr
Hourly Breakout
This scanner will give you short term bet breakouts like hourly or 2Hr breakout
Volume shocker
Volume spurt in a stock with massive X times

Just added Telegram links to https://t.co/lDdqjtKTZL too! Now you can provide a nice easy way for people to message you :)

Less than 1 hour since I started adding stuff to https://t.co/lDdqjtKTZL again, and profile pages are now responsive!!! 🥳 Check it out -> https://t.co/fVkEL4fu0L

Accounts page is now also responsive!! 📱✨

💪 I managed to make the whole site responsive in about an hour. On my roadmap I had it down as 4-5 hours!!! 🤘🤠🤘

