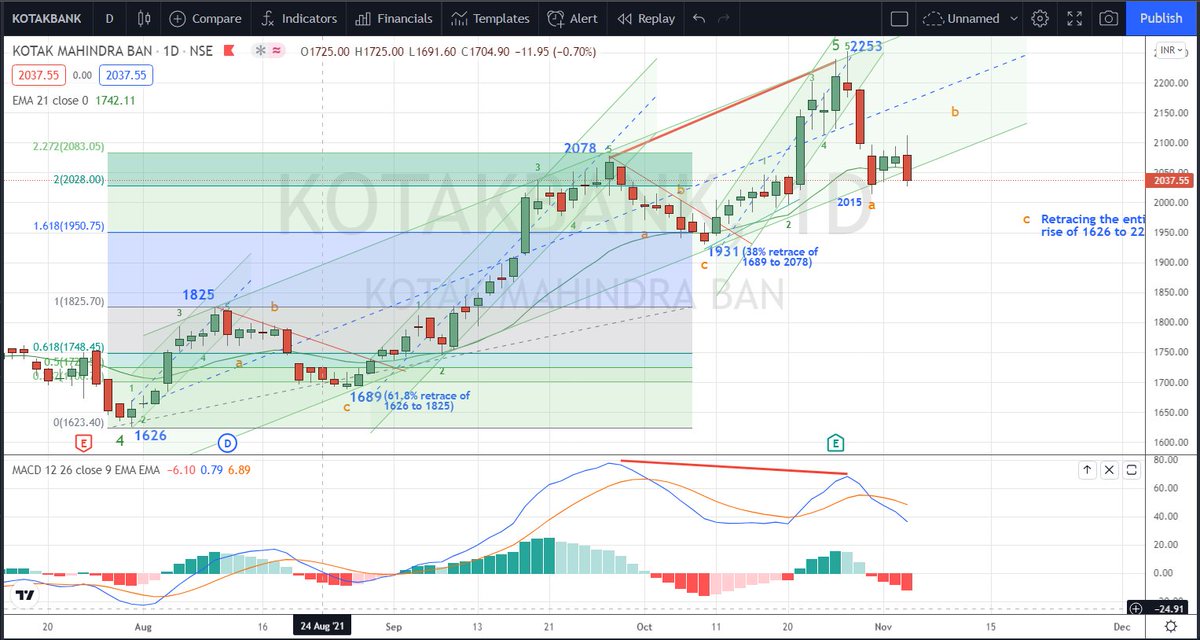
You have the fibonacci retracement cum extension tool in https://t.co/C8fkLCoGfe
You can measure it for any stock/ index. https://t.co/3KBRN2TDLZ
More from Van Ilango (JustNifty)
Have patience; let the market reveal it's hand.
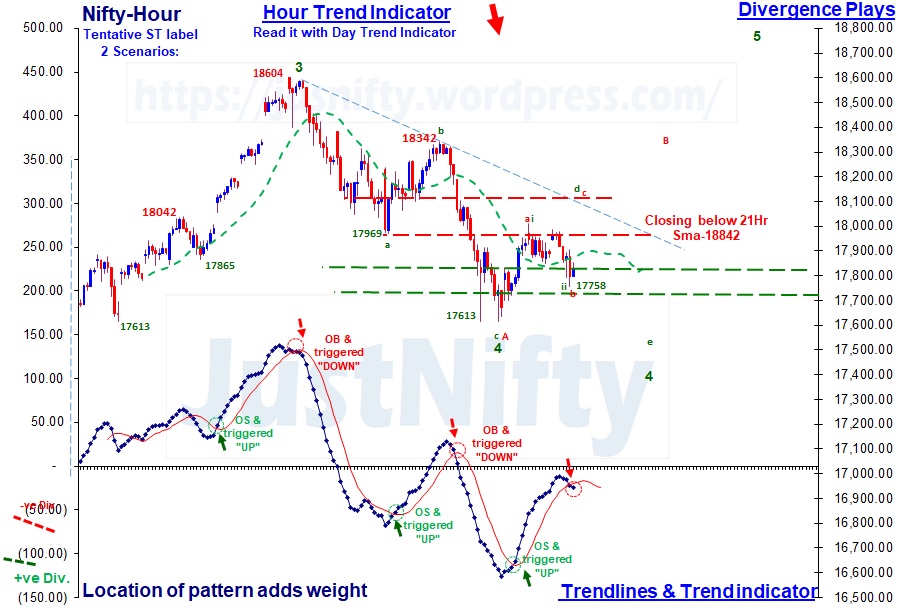
You ask me or any other persons, they'll tell you their subjective view however unbiased they attempt to be.
It is their view and not necessarily the market's.
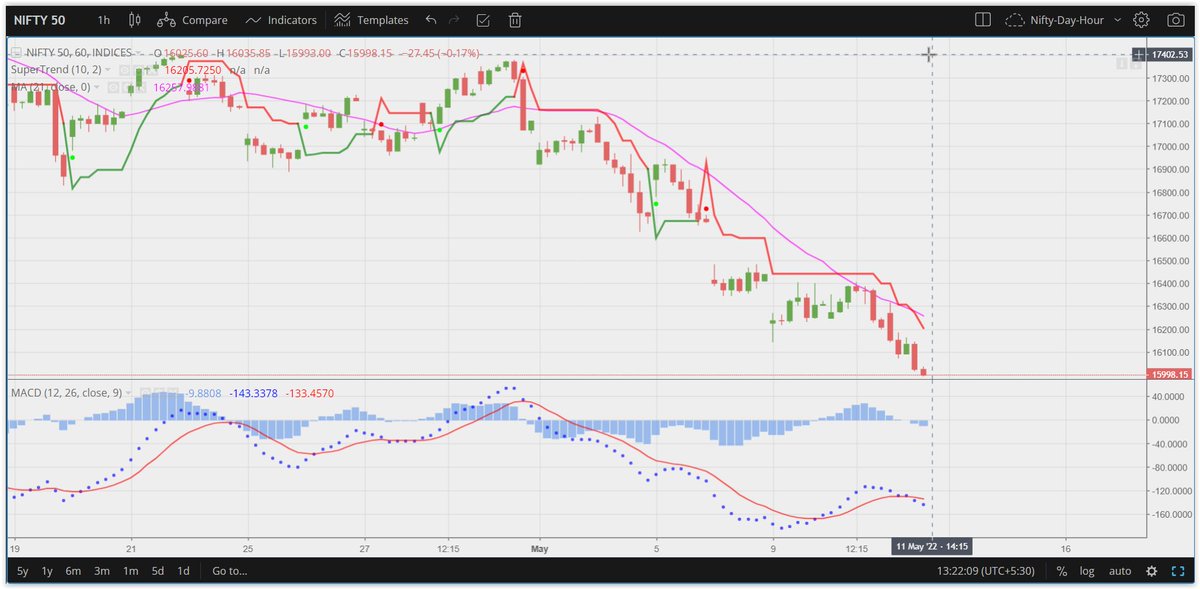
My subjective view is labelled in the charts.
Follow #Priceaction https://t.co/37iXFtWPzU
You ask me or any other persons, they'll tell you their subjective view however unbiased they attempt to be.
It is their view and not necessarily the market's.
My subjective view is labelled in the charts.
Follow #Priceaction https://t.co/37iXFtWPzU
Currently reading the book you put on your website. Also, from this if we consider 18600 as 5 th wave end of Nifty ideally it's doing the 1st 12345 of downtrend, of which do e already 1234, currently going towards 5 which I believe should go below 100% of 4th retracement wave
— de soloist \U0001f1ee\U0001f1f3 (@ChakiArijit) November 4, 2021
More from Screeners


Oil, copper and other commodities came under heavy selling pressure today and that's a good thing because it's mounting evidence that inflation may be peaking.
Positive signs on inflation include fertilizer prices peaking and trending downward. Used Car prices are also down (which led inflation). The recent price break on the $XLE - which emerged almost to the day the market topped, could be an indication that we are close to a low. pic.twitter.com/2MtcKjjmAz
— Mark Minervini (@markminervini) June 23, 2022
You May Also Like

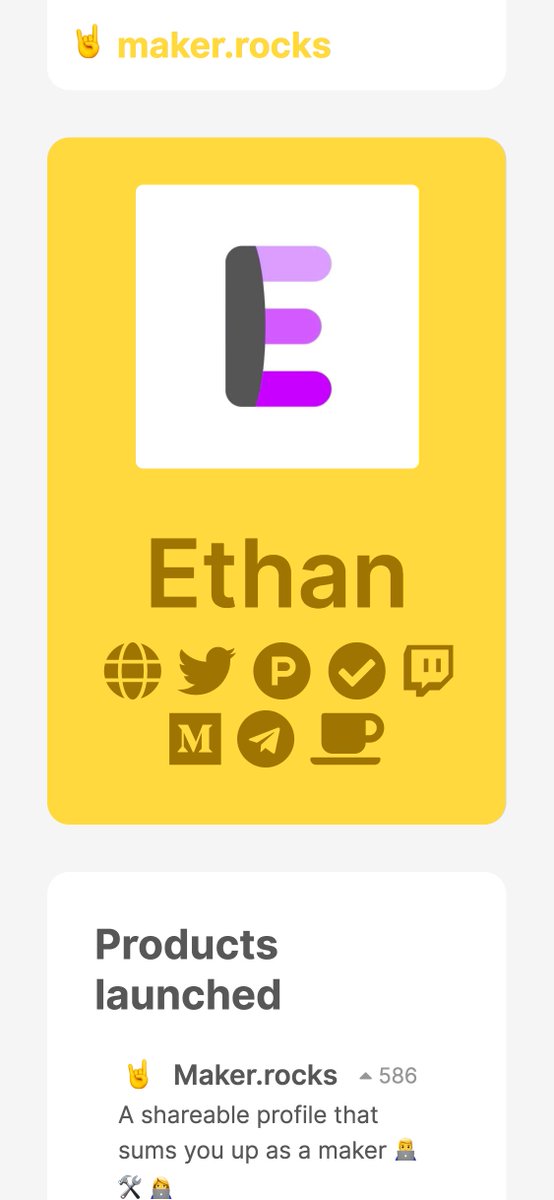
First update to https://t.co/lDdqjtKTZL since the challenge ended – Medium links!! Go add your Medium profile now 👀📝 (thanks @diannamallen for the suggestion 😁)

Just added Telegram links to https://t.co/lDdqjtKTZL too! Now you can provide a nice easy way for people to message you :)

Less than 1 hour since I started adding stuff to https://t.co/lDdqjtKTZL again, and profile pages are now responsive!!! 🥳 Check it out -> https://t.co/fVkEL4fu0L
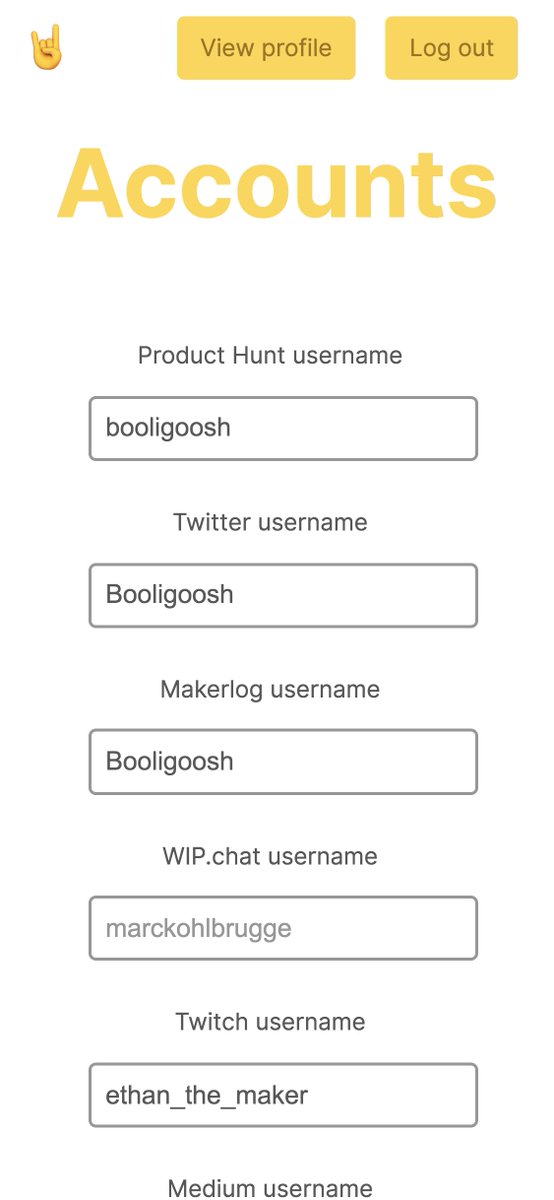
Accounts page is now also responsive!! 📱✨
💪 I managed to make the whole site responsive in about an hour. On my roadmap I had it down as 4-5 hours!!! 🤘🤠🤘
Just added Telegram links to https://t.co/lDdqjtKTZL too! Now you can provide a nice easy way for people to message you :)
Less than 1 hour since I started adding stuff to https://t.co/lDdqjtKTZL again, and profile pages are now responsive!!! 🥳 Check it out -> https://t.co/fVkEL4fu0L
Accounts page is now also responsive!! 📱✨
💪 I managed to make the whole site responsive in about an hour. On my roadmap I had it down as 4-5 hours!!! 🤘🤠🤘