Calculate the total loss you will face in trading portfolio if all SLs are hit if market goes against you.
Select an appropriate strike to buy a Put option left with considerable expiry to hedge your portfolio. Hedging through options is one area which retail investors ignore
More from The_Chartist 📈


More from Screeners


You May Also Like


✨📱 iOS 12.1 📱✨
🗓 Release date: October 30, 2018
📝 New Emojis: 158
https://t.co/bx8XjhiCiB
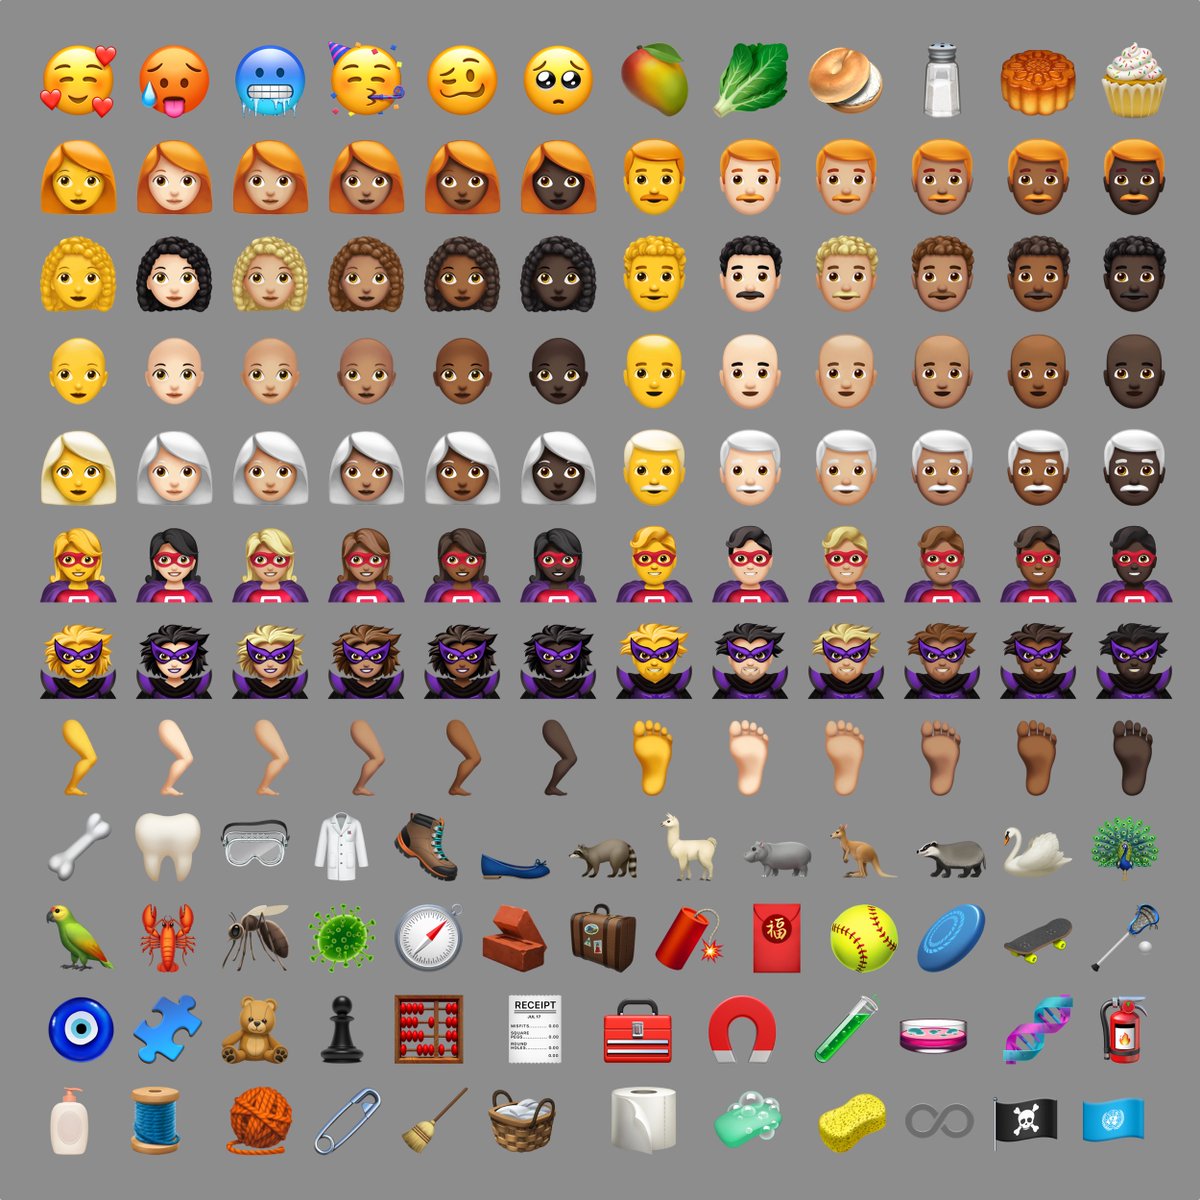
New in iOS 12.1: 🥰 Smiling Face With 3 Hearts https://t.co/6eajdvueip

New in iOS 12.1: 🥵 Hot Face https://t.co/jhTv1elltB

New in iOS 12.1: 🥶 Cold Face https://t.co/EIjyl6yZrF

New in iOS 12.1: 🥳 Partying Face https://t.co/p8FDNEQ3LJ

🗓 Release date: October 30, 2018
📝 New Emojis: 158
https://t.co/bx8XjhiCiB
New in iOS 12.1: 🥰 Smiling Face With 3 Hearts https://t.co/6eajdvueip
New in iOS 12.1: 🥵 Hot Face https://t.co/jhTv1elltB
New in iOS 12.1: 🥶 Cold Face https://t.co/EIjyl6yZrF
New in iOS 12.1: 🥳 Partying Face https://t.co/p8FDNEQ3LJ

Nano Course On Python For Trading
==========================
Module 1
Python makes it very easy to analyze and visualize time series data when you’re a beginner. It's easier when you don't have to install python on your PC (that's why it's a nano course, you'll learn python...
... on the go). You will not be required to install python in your PC but you will be using an amazing python editor, Google Colab Visit https://t.co/EZt0agsdlV
This course is for anyone out there who is confused, frustrated, and just wants this python/finance thing to work!
In Module 1 of this Nano course, we will learn about :
# Using Google Colab
# Importing libraries
# Making a Random Time Series of Black Field Research Stock (fictional)
# Using Google Colab
Intro link is here on YT: https://t.co/MqMSDBaQri
Create a new Notebook at https://t.co/EZt0agsdlV and name it AnythingOfYourChoice.ipynb
You got your notebook ready and now the game is on!
You can add code in these cells and add as many cells as you want
# Importing Libraries
Imports are pretty standard, with a few exceptions.
For the most part, you can import your libraries by running the import.
Type this in the first cell you see. You need not worry about what each of these does, we will understand it later.