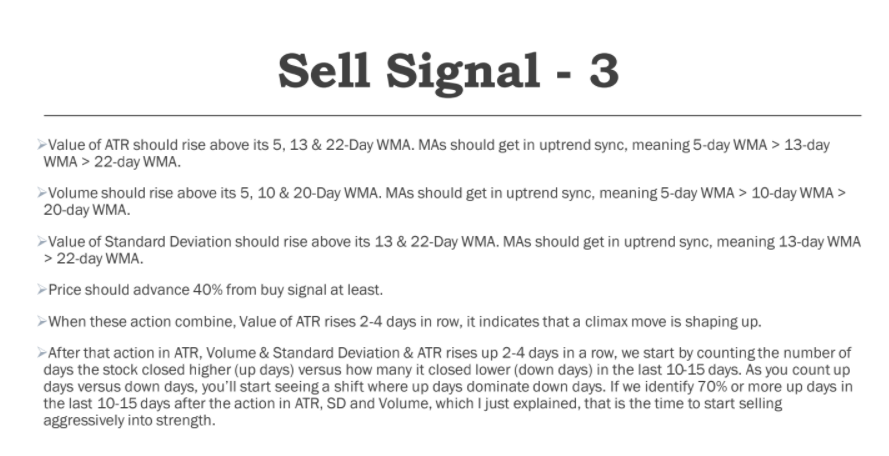
This is one of the sell signals I follow. It should give you some idea.
Since market cap of IRCTC is good, I reduced the move rule from 40% to 30% in this case. https://t.co/qzL5rgmtg8
Just a small doubt . I sold Yesterday thinking it was a climax 6% move . How did you decide to sell today ?
— Volatility and Volume Trader (@VolVolatTrader) September 7, 2021
Any rules where you sell positions . Just to learn
More from Ravi Sharma
For my trading strategy, 13-day & 22-day EMAs are more suitable.
If SmallCap dips below these MAs & they get into the bearish sync, I get cautious & reduce my position size.
Sir as you follow the smallcap index,do you take full positions when it\u2019s trading below its key moving averages or wait for some confirmation? pic.twitter.com/ph6HTJ9rbD
— Dhanesh Gianani (@dhanesh500) November 30, 2021
1) Volatility, Volume & daily range compression scanner
2) Punch-Drunk-Love
3) GE Ratio - to track fundamentally strong stocks
4) Recently created one to track Power Play setups.
I get around 150-200 stocks daily & choose the ones with the most potential.
Sir, How do u find a set up - Do you track chart of each stock daily ? Or do u have filters , that lead you to a number of stocks , after which you scan them.
— AKASH GUPTA (@lockdownmurti) August 25, 2021
1) 50 WMA > 100 WMA > 150 WMA > 200 WMA
2) Price is within 25% range of its 52-Week High and above 30% or more from its 52-Week Low.
Just one question , how do u differentiate stage 2 from 1 , apart from volume , what else do u look ?
— Priyanshu (@Priyans48107837) August 6, 2021
But I can give you some pointers-
1) Choose stocks in Stage 2 with RS > 75
2) Identify these setups - Cup with Handle, High Tight Flag, Rectangle, VCP, Squat, Low Cheat, 3-C.
2) Wait for the significant contraction in daily range, volatility & Volume.
How do u screen stocks???
— \u2206bhishek Jain (@AbhishekTMM) August 6, 2021
More from Screeners


A small tribute/gift to members
Screeners
technical screeners - intraday and positional both
before proceeding - i have helped you , can i ask you so that it can help someone else too
thank you
positional one
run - find #stock - draw chart - find levels
1- Stocks closing daily 2% up from 5 days
https://t.co/gTZrYY3Nht
2- Weekly breakout
https://t.co/1f4ahEolYB
3- Breakouts in short term
https://t.co/BI4h0CdgO2
4- Bullish from last 5
intraday screeners
5- 15 minute Stock Breakouts
https://t.co/9eAo82iuNv
6- Intraday Buying seen in the past 15 minutes
https://t.co/XqAJKhLB5G
7- Stocks trading near day's high on 5 min chart with volume BO intraday
https://t.co/flHmm6QXmo
Thank you


What does it mean?
7 tweets that will teach you about its basics (and much more):🧵
Collaborated with @niki_poojary
1/ What is CPR?
The basics of CPR, how it's calculated, and TC and BC in CPR.
User: @ZerodhaVarsity.
One can also gauge the trend whether bullish or bearish.
Explained in very simple words
@ZerodhaVarsity 2/ What are the Uses of CPR?
User: @YMehta_
A thread that provides examples along with the concept.
Also includes an Intraday Trading Setup on 5 min
#CPR is an indicator which is used for #Intraday in Stock Market.
— Yash Mehta (@YMehta_) November 19, 2021
This learning thread would be on
"\U0001d650\U0001d668\U0001d65a\U0001d668 \U0001d664\U0001d65b \U0001d63e\U0001d64b\U0001d64d"
Like\u2764\ufe0f& Retweet\U0001f501for wider reach and for more such learning thread in the future.
Also, an investment strategy is shared using CPR in the end.
1/24
@ZerodhaVarsity @YMehta_ 3/ How to analyze trends with CPR?
User: @cprbykgs
How to interpret CPR based on the candles forming either above or below the daily and weekly CPR.
He is the most famous guy when it comes to CPR, so go through his Twitter and Youtube
CPR indicator trend analysis:
— Gomathi Shankar (@cprbykgs) January 25, 2022
Candles below daily & weekly CPR \U0001f43b
Candles above daily CPR but below weekly CPR early confirmation of \U0001f402
Candles above daily + weekly CPR strong confirmation of \U0001f402
Isn\u2019t it simple?#cprbykgs #cprindicator #nifty #banknifty
@ZerodhaVarsity @YMehta_ @cprbykgs 4/ Interpreting longer timeframes with CPR
User: @cprbykgs
Trend Reversals with CPR when the trend is bullish and it enters the daily CPR
#banknifty
— Gomathi Shankar (@cprbykgs) July 9, 2021
Candles above monthly CPR- Bullish
Candles above weekly CPR- Bullish
Now, whenever candles enter daily CPR range it indicates weakness of current trend & early signs of trend reversal.
So, wait for the candles to exit the daily CPR range then take the trade. (1/4) pic.twitter.com/7vaaLMCrV8