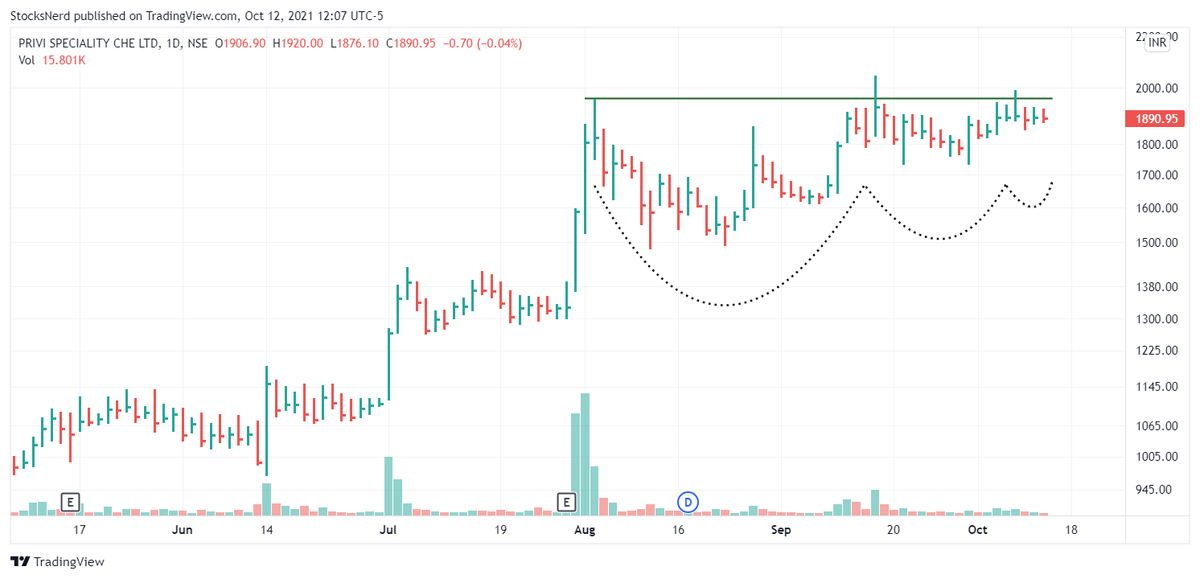
Instead of Simple Moving Averages, I use Weighted Moving Averages. I use the following signals to identify Stage 2-
1) 50 WMA > 100 WMA > 150 WMA > 200 WMA
2) Price is within 25% range of its 52-Week High and above 30% or more from its 52-Week Low.
Just one question , how do u differentiate stage 2 from 1 , apart from volume , what else do u look ?
— Priyanshu (@Priyans48107837) August 6, 2021
More from Ravi Sharma
You would find the roots of all patterns, especially the trend/momentum following ones in their methods.
Once you get the dynamics of Price/Volume, any good book on chart patterns will do.
Any book in which we can read such patterns and the knowledge you have?
— Krish (@MasculinityMon1) August 13, 2021
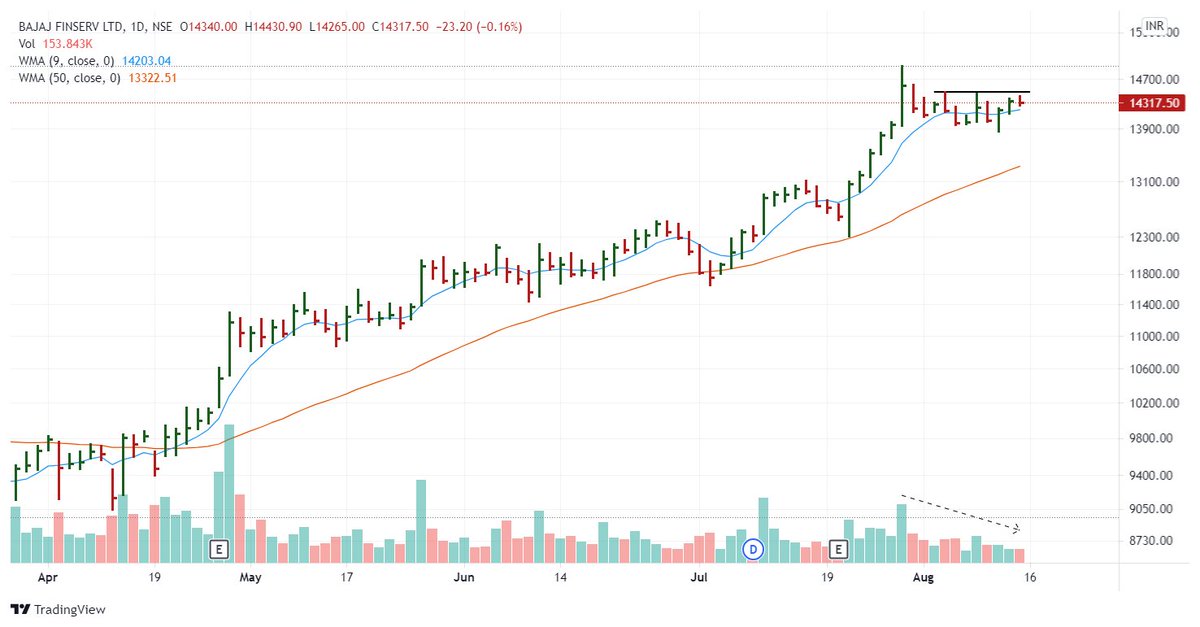
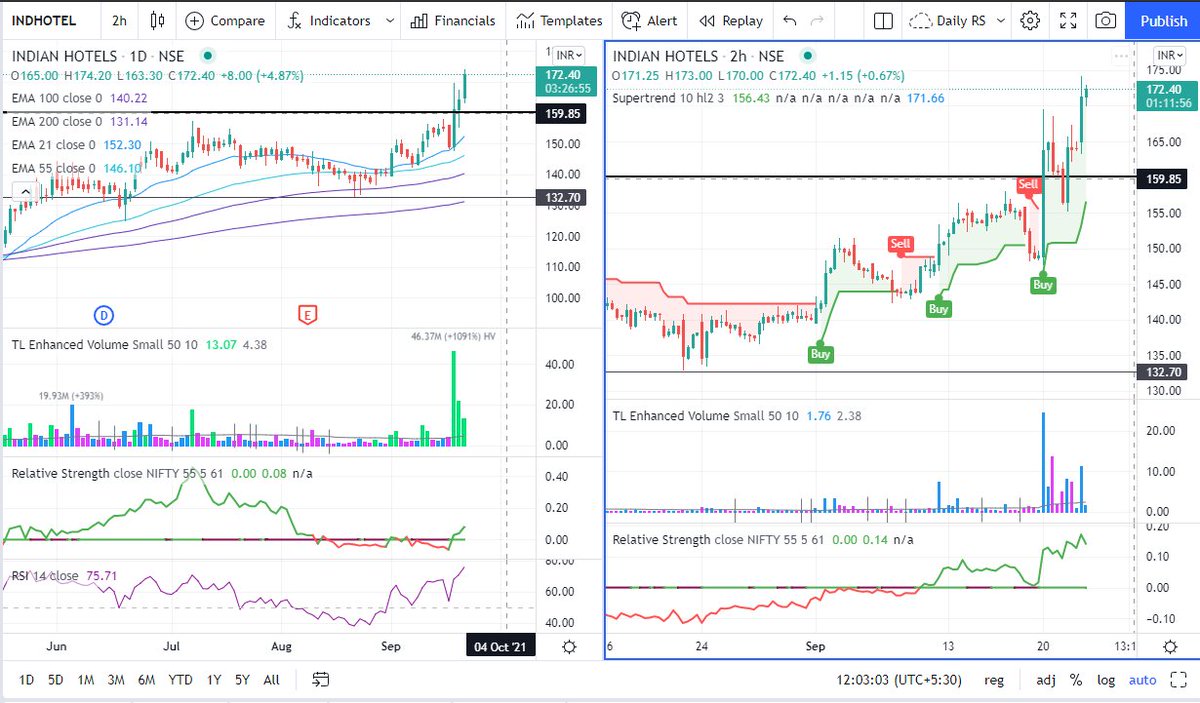
While buying breakouts, your odds will improve a lot when you prefer the following:
1. Strong Relative Strength.
2. Tight price range on low Volume and a pattern which is easy on eyes. https://t.co/CprKpAfgtj
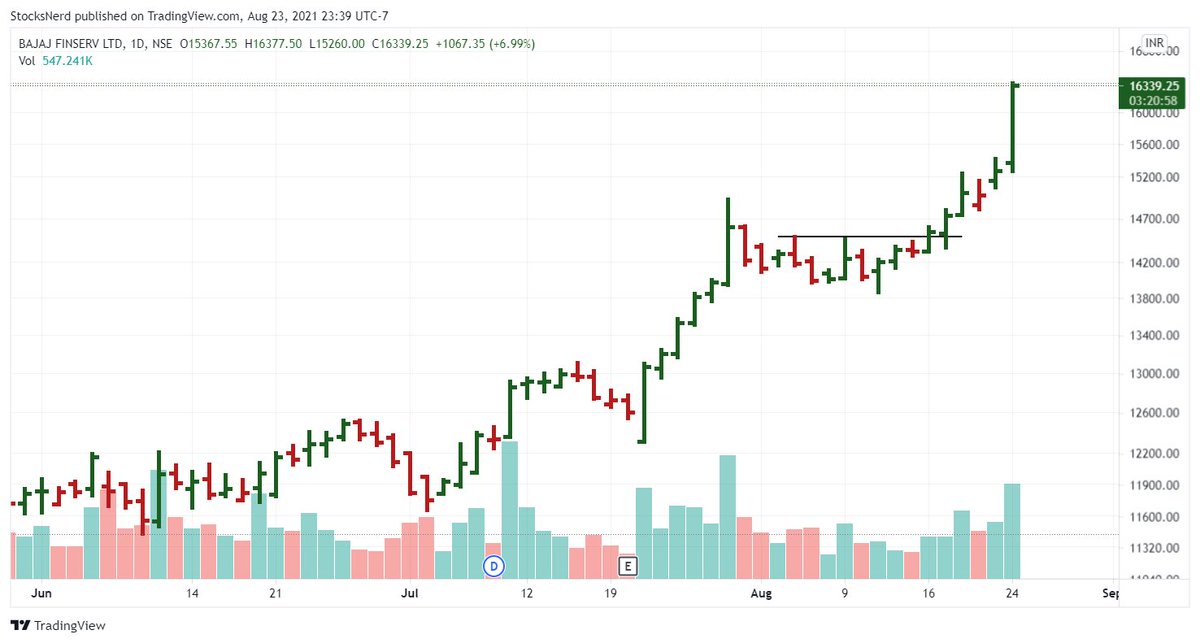
#BAJAJFINSV
— Ravi Sharma (@StocksNerd) August 14, 2021
Setting up in a tight base. Volume has been drying up.
Waiting for the breakout. pic.twitter.com/KWoGZAwkLO
More from Screeners


Sharing 9 Screeners🧵
1. Swing Trading Techno Funda https://t.co/sV6e8XSFRK
2.Range Breakout
https://t.co/SNKEpGHNtv
3. Stocks in Tight Range :
https://t.co/MqDFMEfj82
Telegram Link : https://t.co/b4N4oPjqm9
Retweet and Share !
4.Stock Closing up 3% Since 3 days
https://t.co/vLGG9k3YKz
5. Close above 21 ema
https://t.co/fMZkgLczxR
6. Days Fall and Reversal
7. 52 WEEK high Stocks.
https://t.co/H6Z6IGMRwS
8. Intraday Stocks :https://t.co/JoXYRcogj7
9. Darvas Box

What does it mean?
7 tweets that will teach you about its basics (and much more):🧵
Collaborated with @niki_poojary
1/ What is CPR?
The basics of CPR, how it's calculated, and TC and BC in CPR.
User: @ZerodhaVarsity.
One can also gauge the trend whether bullish or bearish.
Explained in very simple words
@ZerodhaVarsity 2/ What are the Uses of CPR?
User: @YMehta_
A thread that provides examples along with the concept.
Also includes an Intraday Trading Setup on 5 min
#CPR is an indicator which is used for #Intraday in Stock Market.
— Yash Mehta (@YMehta_) November 19, 2021
This learning thread would be on
"\U0001d650\U0001d668\U0001d65a\U0001d668 \U0001d664\U0001d65b \U0001d63e\U0001d64b\U0001d64d"
Like\u2764\ufe0f& Retweet\U0001f501for wider reach and for more such learning thread in the future.
Also, an investment strategy is shared using CPR in the end.
1/24
@ZerodhaVarsity @YMehta_ 3/ How to analyze trends with CPR?
User: @cprbykgs
How to interpret CPR based on the candles forming either above or below the daily and weekly CPR.
He is the most famous guy when it comes to CPR, so go through his Twitter and Youtube
CPR indicator trend analysis:
— Gomathi Shankar (@cprbykgs) January 25, 2022
Candles below daily & weekly CPR \U0001f43b
Candles above daily CPR but below weekly CPR early confirmation of \U0001f402
Candles above daily + weekly CPR strong confirmation of \U0001f402
Isn\u2019t it simple?#cprbykgs #cprindicator #nifty #banknifty
@ZerodhaVarsity @YMehta_ @cprbykgs 4/ Interpreting longer timeframes with CPR
User: @cprbykgs
Trend Reversals with CPR when the trend is bullish and it enters the daily CPR
#banknifty
— Gomathi Shankar (@cprbykgs) July 9, 2021
Candles above monthly CPR- Bullish
Candles above weekly CPR- Bullish
Now, whenever candles enter daily CPR range it indicates weakness of current trend & early signs of trend reversal.
So, wait for the candles to exit the daily CPR range then take the trade. (1/4) pic.twitter.com/7vaaLMCrV8