Extremely excited today to reveal the first of two great works (magnus opera?), just posted on bioarxiv, applying regulatory network analysis techniques to PDAC expression data to dissect the underlying biology of the disease. Tweetorial time! 1/


More from Science


https://t.co/hXlo8qgkD0
Look like that they got a classical case of PCR Cross-Contamination.
They had 2 fabricated samples (SRX9714436 and SRX9714921) on the same PCR run. Alongside with Lung07. They did not perform metagenomic sequencing on the “feces” and they did not get

A positive oral or anal swab from anywhere in their sampling. Feces came from anus and if these were positive the anal swabs must also be positive. Clearly it got there after the NA have been extracted and were from the very low-level degraded RNA which were mutagenized from
The Taq. https://t.co/yKXCgiT29w to see SRX9714921 and SRX9714436.
Human+Mouse in the positive SRA, human in both of them. Seeing human+mouse in identical proportions across 3 different sequencers (PRJNA573298, A22, SEX9714436) are pretty straight indication that the originals
Were already contaminated with Human and mouse from the very beginning, and that this contamination is due to dishonesty in the sample handling process which prescribe a spiking of samples in ACE2-HEK293T/A549, VERO E6 and Human lung xenograft mouse.
The “lineages” they claimed to have found aren’t mutational lineages at all—all the mutations they see on these sequences were unique to that specific sequence, and are the result of RNA degradation and from the Taq polymerase errors accumulated from the nested PCR process

Look like that they got a classical case of PCR Cross-Contamination.
They had 2 fabricated samples (SRX9714436 and SRX9714921) on the same PCR run. Alongside with Lung07. They did not perform metagenomic sequencing on the “feces” and they did not get
A positive oral or anal swab from anywhere in their sampling. Feces came from anus and if these were positive the anal swabs must also be positive. Clearly it got there after the NA have been extracted and were from the very low-level degraded RNA which were mutagenized from
The Taq. https://t.co/yKXCgiT29w to see SRX9714921 and SRX9714436.
Human+Mouse in the positive SRA, human in both of them. Seeing human+mouse in identical proportions across 3 different sequencers (PRJNA573298, A22, SEX9714436) are pretty straight indication that the originals
Were already contaminated with Human and mouse from the very beginning, and that this contamination is due to dishonesty in the sample handling process which prescribe a spiking of samples in ACE2-HEK293T/A549, VERO E6 and Human lung xenograft mouse.
The “lineages” they claimed to have found aren’t mutational lineages at all—all the mutations they see on these sequences were unique to that specific sequence, and are the result of RNA degradation and from the Taq polymerase errors accumulated from the nested PCR process


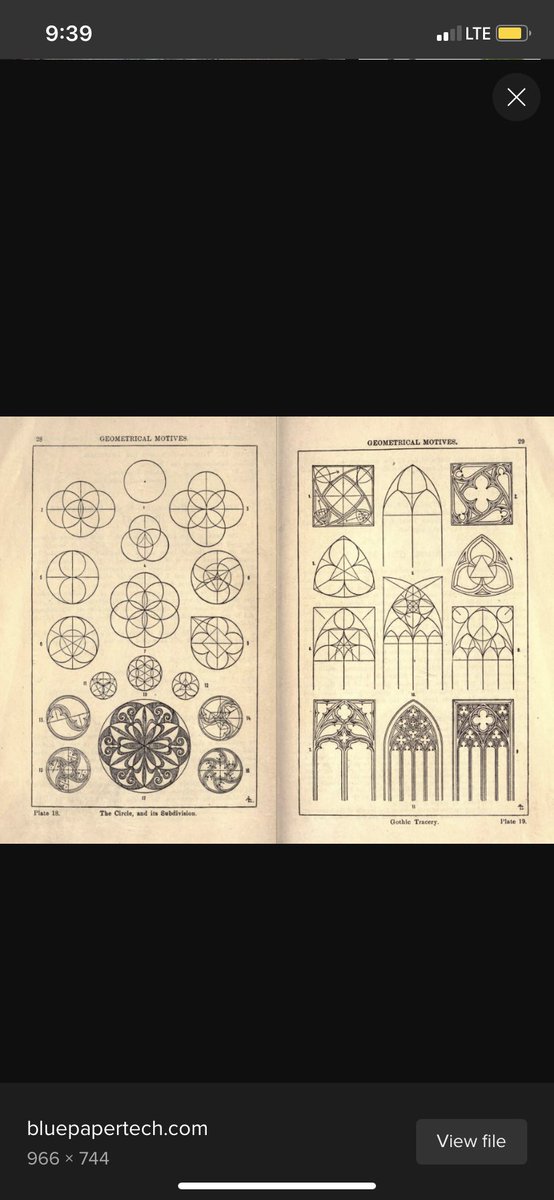
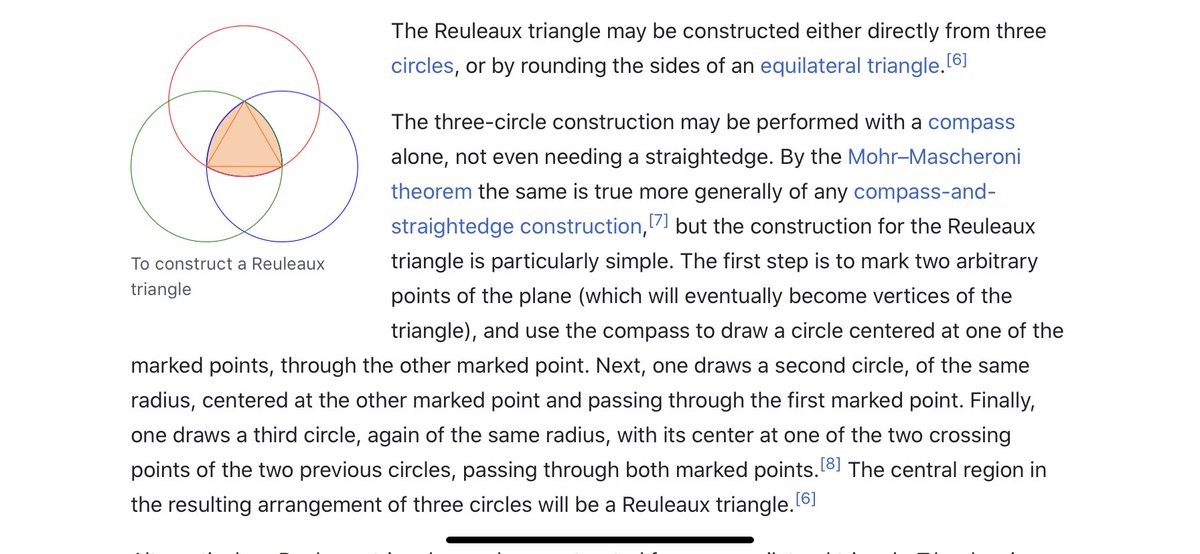
I think we have to expand our thinking about the toroidal sphere even more. When looking at maps, I noticed the da Vinci map, from 1514, which uses the Reuleaux Triangle. This triangle is formed from 3 intersecting circles, and is in the center of a trefoil.

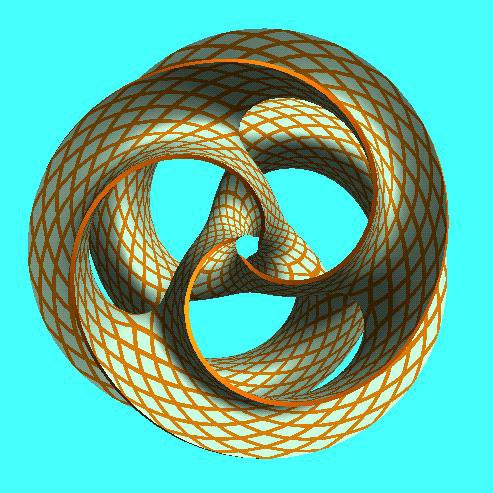
The trefoil is the focal point in many gothic structures, repeatedly and prominently shown. It is represented in many ways. ‘Going down the rabbit hole’ now makes sense, if you understand the center point of the ears is the center of the torus, with the rabbit trefoil.
The trefoil can be found within the toroidal field. Here is a fun site, where you can manipulate it yourself. https://t.co/FCMcybuuFC
The wiki page makes it seem like there isn’t much of importance with the Reuleaux Triangle, besides being used for coinage, or some stupid bike. But the Wankel engine is an interesting engine, using this geometric design https://t.co/ayPOgkAqGN

https://t.co/m9EaWwF796
The trefoil is the focal point in many gothic structures, repeatedly and prominently shown. It is represented in many ways. ‘Going down the rabbit hole’ now makes sense, if you understand the center point of the ears is the center of the torus, with the rabbit trefoil.
The trefoil can be found within the toroidal field. Here is a fun site, where you can manipulate it yourself. https://t.co/FCMcybuuFC
The wiki page makes it seem like there isn’t much of importance with the Reuleaux Triangle, besides being used for coinage, or some stupid bike. But the Wankel engine is an interesting engine, using this geometric design https://t.co/ayPOgkAqGN
https://t.co/m9EaWwF796

The endangered whales must contend with up to 1,000 boats moving daily through an important feeding area in the eastern South Pacific, according to research published in the scientific journal Nature.@WeDontHaveTime
#ForNature @JohnKerry
#ForNature @JohnKerry
Blue whales threatened by ship collisions in busy Patagonia waters
— James Mitchell \u24cb\U0001f42c (@MesMitch) February 1, 2021
Endangered giants face potentially fatal encounters with the 1,000 daily fishing vessels moving through main feeding area off Chile, scientists warn\U0001f43b\u200d\u2744\ufe0f@WeDontHaveTime
#ForNature @JohnKerry
You May Also Like


Trading view scanner process -
1 - open trading view in your browser and select stock scanner in left corner down side .
2 - touch the percentage% gain change ( and u can see higest gainer of today)
3. Then, start with 6% gainer to 20% gainer and look charts of everyone in daily Timeframe . (For fno selection u can choose 1% to 4% )
4. Then manually select the stocks which are going to give all time high BO or 52 high BO or already given.
5. U can also select those stocks which are going to give range breakout or already given range BO
6 . If in 15 min chart📊 any stock sustaing near BO zone or after BO then select it on your watchlist
7 . Now next day if any stock show momentum u can take trade in it with RM
This looks very easy & simple but,
U will amazed to see it's result if you follow proper risk management.
I did 4x my capital by trading in only momentum stocks.
I will keep sharing such learning thread 🧵 for you 🙏💞🙏
Keep learning / keep sharing 🙏
@AdityaTodmal
1 - open trading view in your browser and select stock scanner in left corner down side .
2 - touch the percentage% gain change ( and u can see higest gainer of today)
Making thread \U0001f9f5 on trading view scanner by which you can select intraday and btst stocks .
— Vikrant (@Trading0secrets) October 22, 2021
In just few hours (Without any watchlist)
Some manual efforts u have to put on it.
Soon going to share the process with u whenever it will be ready .
"How's the josh?"guys \U0001f57a\U0001f3b7\U0001f483
3. Then, start with 6% gainer to 20% gainer and look charts of everyone in daily Timeframe . (For fno selection u can choose 1% to 4% )
4. Then manually select the stocks which are going to give all time high BO or 52 high BO or already given.
5. U can also select those stocks which are going to give range breakout or already given range BO
6 . If in 15 min chart📊 any stock sustaing near BO zone or after BO then select it on your watchlist
7 . Now next day if any stock show momentum u can take trade in it with RM
This looks very easy & simple but,
U will amazed to see it's result if you follow proper risk management.
I did 4x my capital by trading in only momentum stocks.
I will keep sharing such learning thread 🧵 for you 🙏💞🙏
Keep learning / keep sharing 🙏
@AdityaTodmal