
NTPC/Nifty chart suggest the outperformance may have just began. https://t.co/RgaTmwBrX7
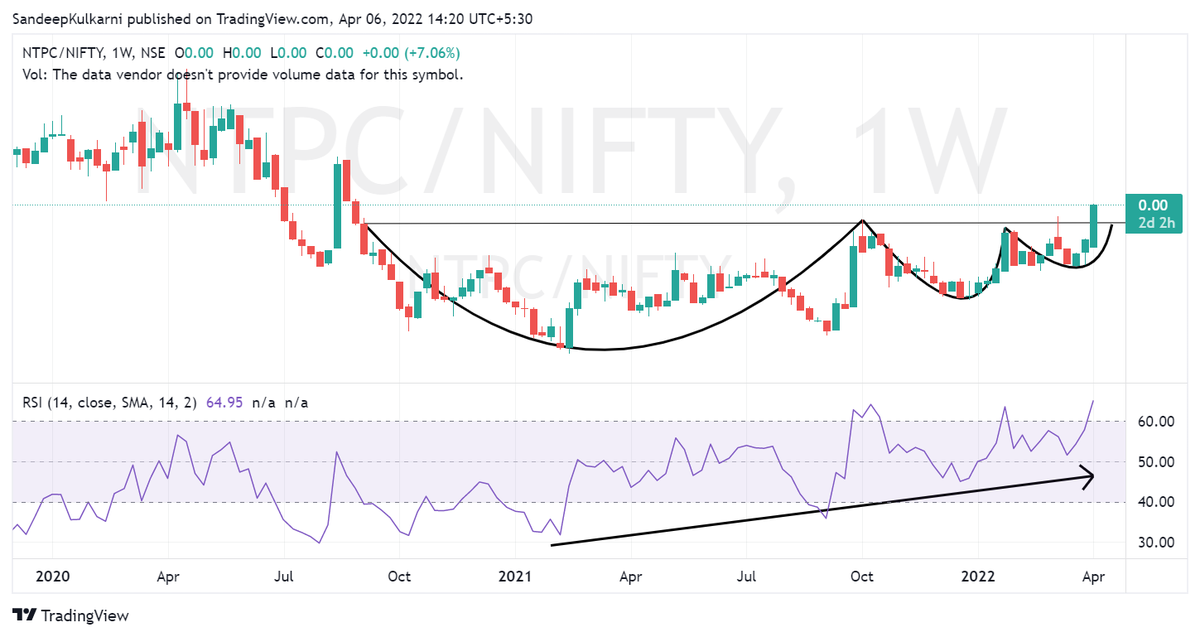
Funds with high % of NTPC. pic.twitter.com/vIiyrvAvQn
— Mahesh \U0001f1ee\U0001f1f3 (@invest_mutual) April 6, 2022
More from Sandeep Kulkarni
History tells us when #USDINR moves it moves a lot. In that context it has been remarkably resilient with just 8% depreciation. It looks like we are very close to the point from where Rupee will start to appreciating again.
BTW Nifty Metal has inverse correlation with USDINR. https://t.co/X6cqVcYF3V
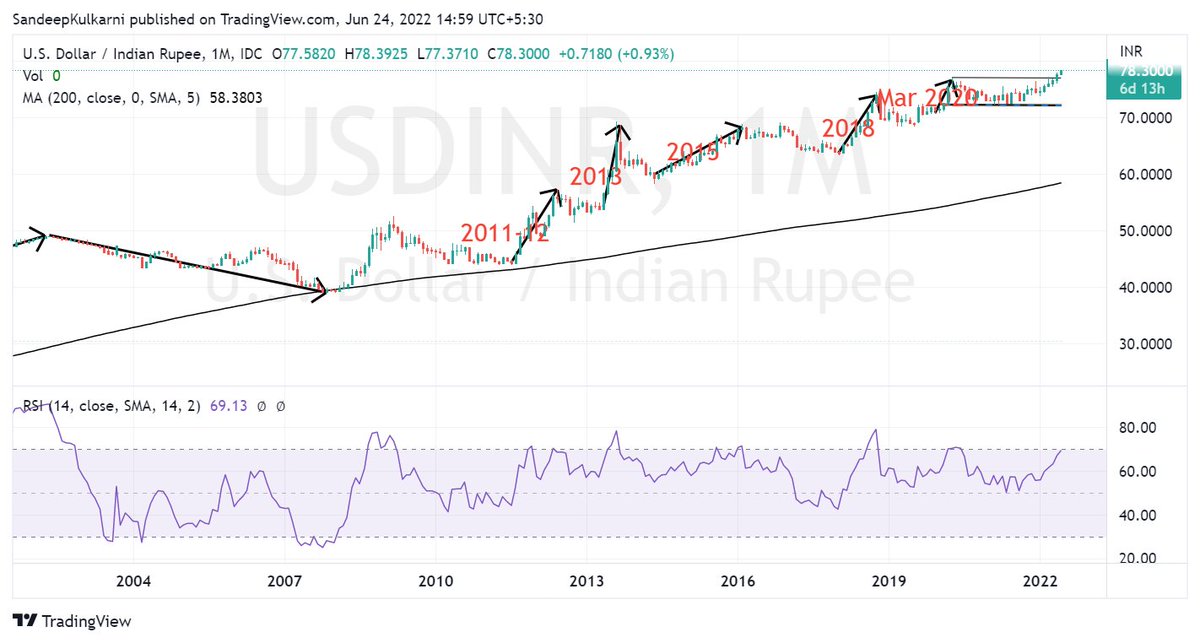
BTW Nifty Metal has inverse correlation with USDINR. https://t.co/X6cqVcYF3V
We know how our stock market has weathered the FII selling.
— Sandeep Kulkarni (@moneyworks4u_fa) June 10, 2022
But the equally big story is how Rupee has weathered $50bn+ outflows since Oct 2021. Hats off to RBI Governor Das & his team for having the vision of building huge reserves in his tenure. pic.twitter.com/CVuF9dM361
Aged well as markets bottomed out before or on the day of first Fed rate hike.
This is Nifty's chart from 2004 to 2006. Back then also US interest rates had gone up. Markets had corrected well before Fed had hiked rates for first time in 2004, from then it hiked rates 17 times by 4.25% over next 2 yrs and yet market kept making new highs. @shivaji_1983 pic.twitter.com/EAFhske9EE
— Sandeep Kulkarni (@moneyworks4u_fa) February 11, 2022

You May Also Like


@franciscodeasis https://t.co/OuQaBRFPu7
Unfortunately the "This work includes the identification of viral sequences in bat samples, and has resulted in the isolation of three bat SARS-related coronaviruses that are now used as reagents to test therapeutics and vaccines." were BEFORE the

chimeric infectious clone grants were there.https://t.co/DAArwFkz6v is in 2017, Rs4231.
https://t.co/UgXygDjYbW is in 2016, RsSHC014 and RsWIV16.
https://t.co/krO69CsJ94 is in 2013, RsWIV1. notice that this is before the beginning of the project
starting in 2016. Also remember that they told about only 3 isolates/live viruses. RsSHC014 is a live infectious clone that is just as alive as those other "Isolates".
P.D. somehow is able to use funds that he have yet recieved yet, and send results and sequences from late 2019 back in time into 2015,2013 and 2016!
https://t.co/4wC7k1Lh54 Ref 3: Why ALL your pangolin samples were PCR negative? to avoid deep sequencing and accidentally reveal Paguma Larvata and Oryctolagus Cuniculus?
Unfortunately the "This work includes the identification of viral sequences in bat samples, and has resulted in the isolation of three bat SARS-related coronaviruses that are now used as reagents to test therapeutics and vaccines." were BEFORE the
chimeric infectious clone grants were there.https://t.co/DAArwFkz6v is in 2017, Rs4231.
https://t.co/UgXygDjYbW is in 2016, RsSHC014 and RsWIV16.
https://t.co/krO69CsJ94 is in 2013, RsWIV1. notice that this is before the beginning of the project
starting in 2016. Also remember that they told about only 3 isolates/live viruses. RsSHC014 is a live infectious clone that is just as alive as those other "Isolates".
P.D. somehow is able to use funds that he have yet recieved yet, and send results and sequences from late 2019 back in time into 2015,2013 and 2016!
https://t.co/4wC7k1Lh54 Ref 3: Why ALL your pangolin samples were PCR negative? to avoid deep sequencing and accidentally reveal Paguma Larvata and Oryctolagus Cuniculus?
