
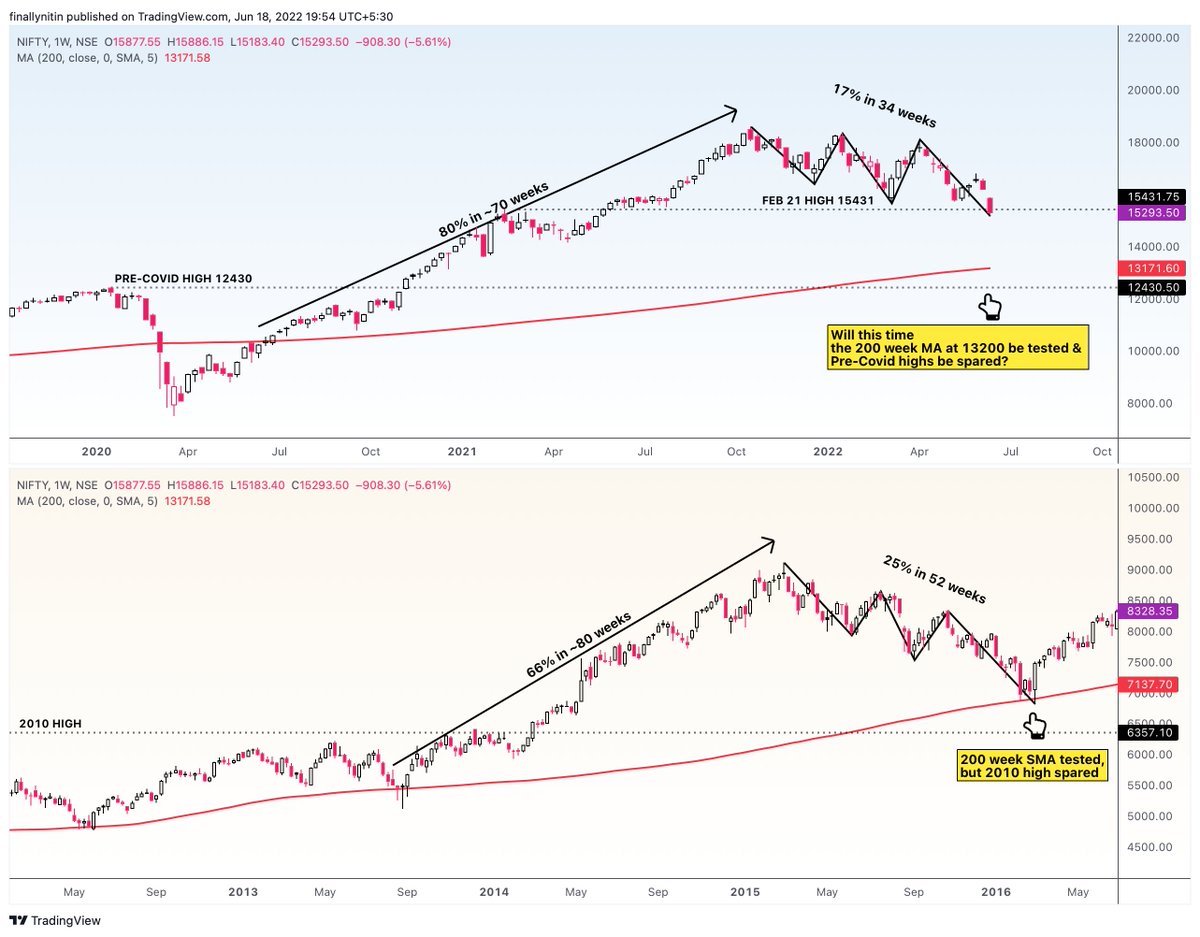
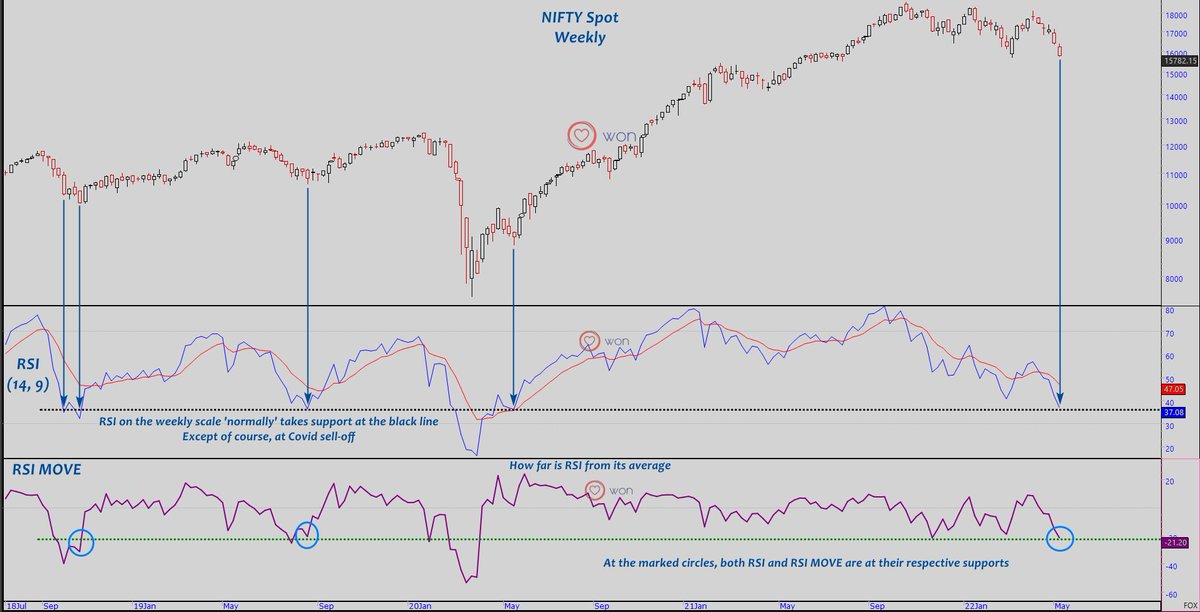
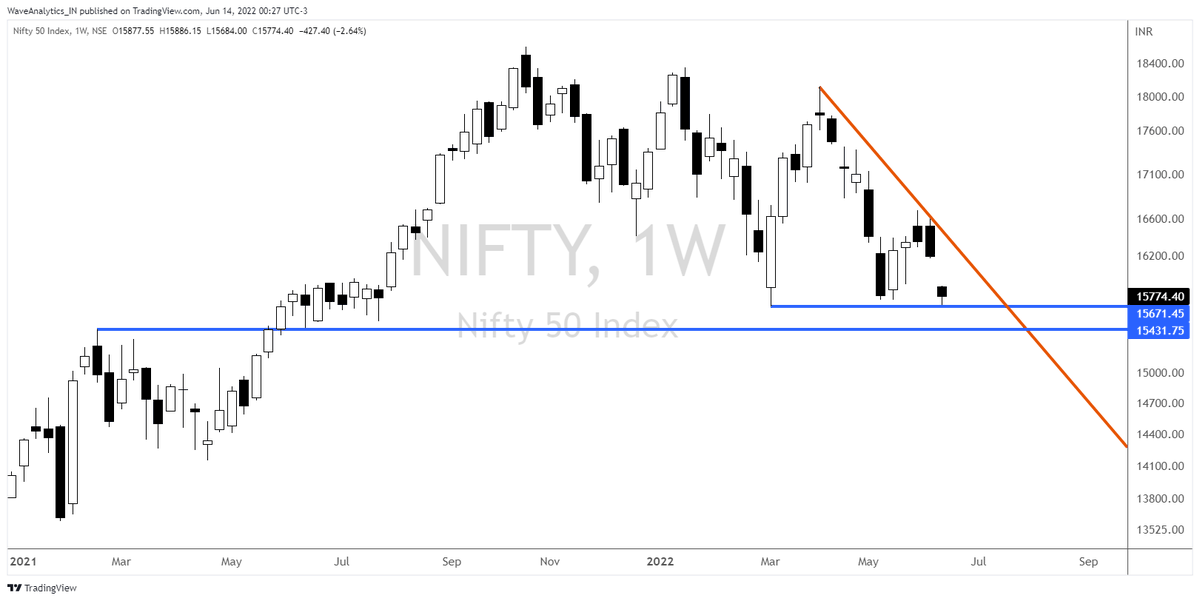
#NIFTY weekly chart showing some similarities with the 2015-16 fall.
Both falls were preceded by an almost non-stop bull run for 1-2 years (counting from last retest of 200-week SMA).
In 2015-16, index fell 25% in 52 weeks. So far, from Oct 21, we have fallen 17% in 34 weeks.
More from Nitin R


More from Niftylongterm


Well, alarms were sound.
₹Nifty > #Nifty
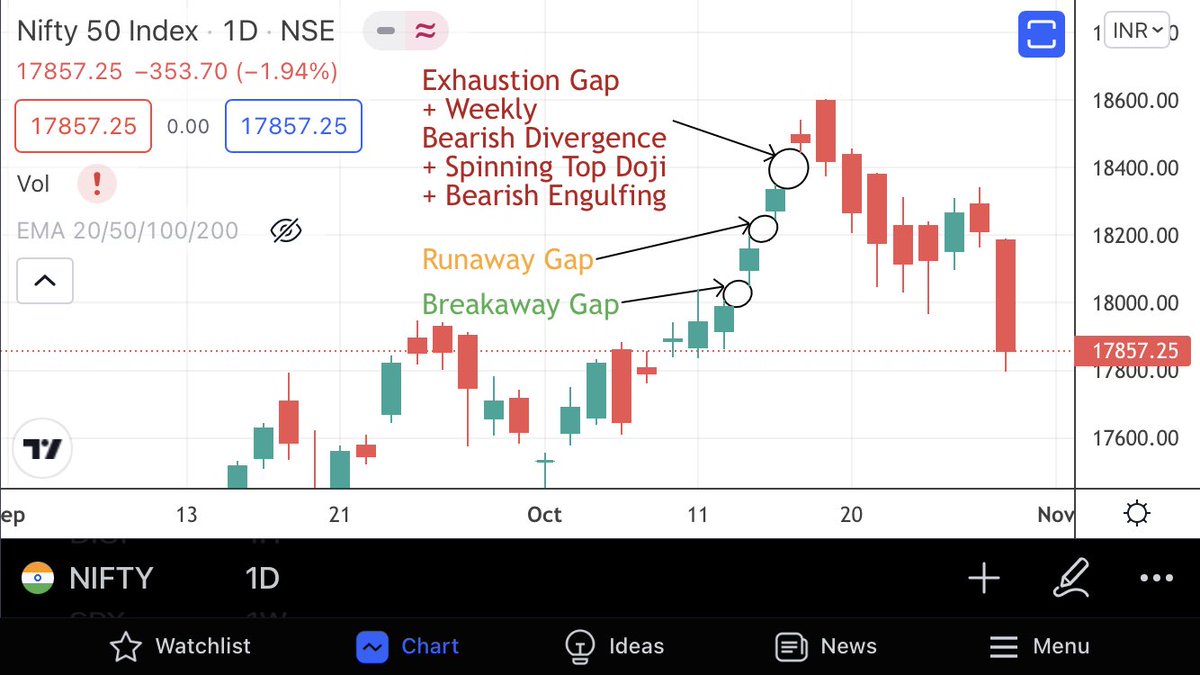
Explanation for the alarm that sounded. Textbook short term top.
Clean technicals.
₹Nifty > #Nifty
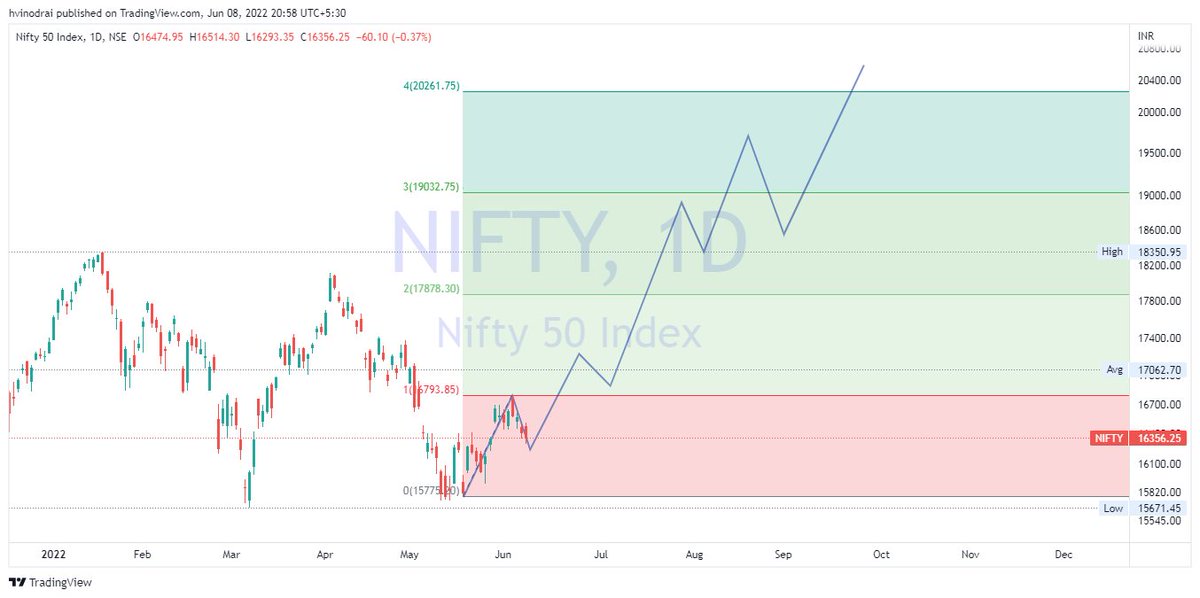
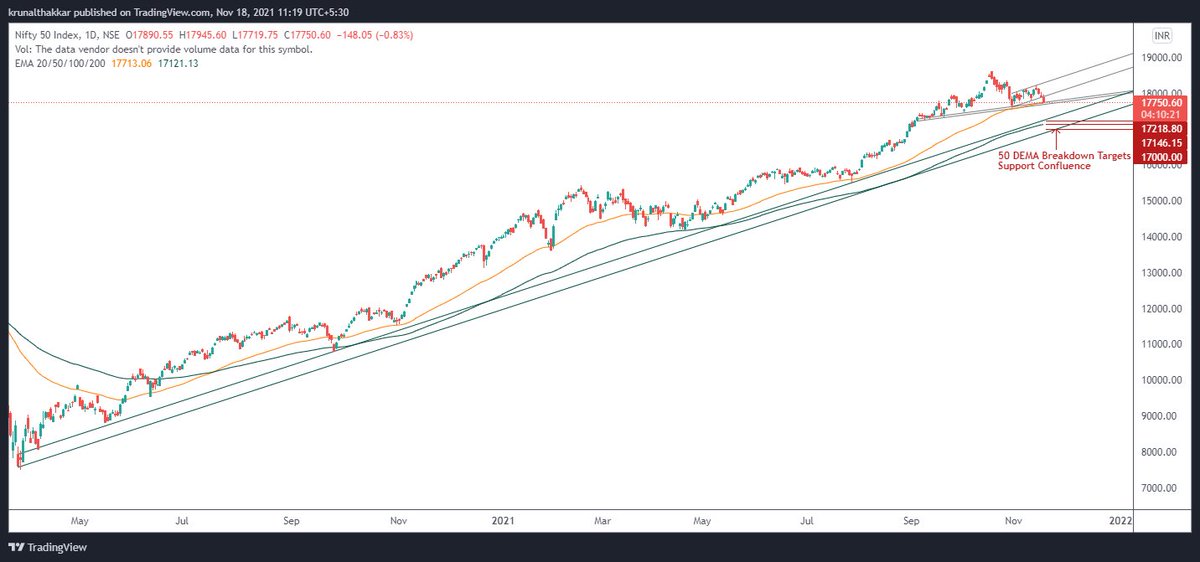
Is Nifty gunning for an ultimate double zig-zag shake out towards 17k which would coincide with weekly 20 EMA and 100 DEMA tag? Fair possibility. Only time will tell. Watch for the break of 50 DEMA and support zone.
₹Nifty > #Nifty
@piyushchaudhry
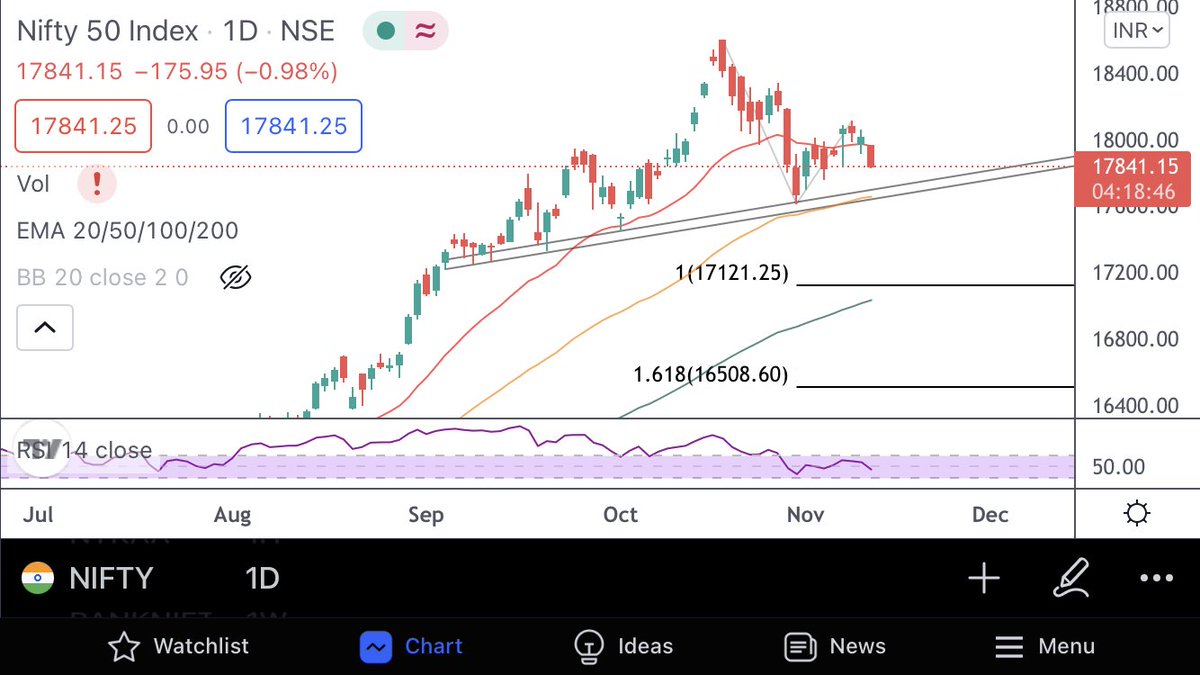
If Nifty breaks 50 DEMA and closes below 17700. 17220-17150-17000 possible. Worst case scenario is ~17000. Lot of confluence support in that range.
Do your DD.
₹Nifty > #Nifty
Nifty’s daily looks like ABC is done, but internals suggests that it still needs a final sell off to make a bottom for WXY. A bull trap towards 17735-17810 can’t be ruled out before the final sell off.
Just analysis, reserve the right to be wrong.
₹Nifty > #Nifty
₹Nifty > #Nifty
Tight Bearish divergence on Nifty Weekly. Ready to snap back to Weekly 20 EMA? Current Weekly 20 EMA at 16864. Stay Cautious!
— Krunal Thakkar (@KrunallThakkar) October 22, 2021
\u20b9Nifty > #Nifty
Explanation for the alarm that sounded. Textbook short term top.
Clean technicals.
₹Nifty > #Nifty
Is Nifty gunning for an ultimate double zig-zag shake out towards 17k which would coincide with weekly 20 EMA and 100 DEMA tag? Fair possibility. Only time will tell. Watch for the break of 50 DEMA and support zone.
₹Nifty > #Nifty
@piyushchaudhry
If Nifty breaks 50 DEMA and closes below 17700. 17220-17150-17000 possible. Worst case scenario is ~17000. Lot of confluence support in that range.
Do your DD.
₹Nifty > #Nifty
Nifty’s daily looks like ABC is done, but internals suggests that it still needs a final sell off to make a bottom for WXY. A bull trap towards 17735-17810 can’t be ruled out before the final sell off.
Just analysis, reserve the right to be wrong.
₹Nifty > #Nifty


You May Also Like


1/Politics thread time.
To me, the most important aspect of the 2018 midterms wasn't even about partisan control, but about democracy and voting rights. That's the real battle.
2/The good news: It's now an issue that everyone's talking about, and that everyone cares about.
3/More good news: Florida's proposition to give felons voting rights won. But it didn't just win - it won with substantial support from Republican voters.
That suggests there is still SOME grassroots support for democracy that transcends
4/Yet more good news: Michigan made it easier to vote. Again, by plebiscite, showing broad support for voting rights as an
5/OK, now the bad news.
We seem to have accepted electoral dysfunction in Florida as a permanent thing. The 2000 election has never really
Bad ballot design led to a lot of undervotes for Bill Nelson in Broward Co., possibly even enough to cost him his Senate seat. They do appear to be real undervotes, though, instead of tabulation errors. He doesn't really seem to have a path to victory. https://t.co/utUhY2KTaR
— Nate Silver (@NateSilver538) November 16, 2018